
Figure 3.
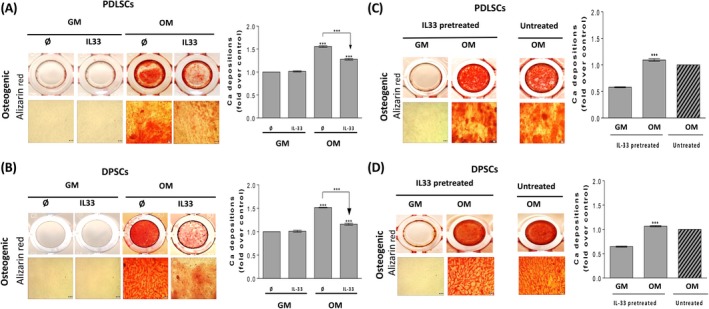
Effect of IL‐33 treatment and pretreatment on osteogenic differentiation capacity of PDLSCs and DPSCs. Osteogenic differentiation detected after 14 d using Alizarin red (Scale bars: 50 µm), quantification of Ca depositions. Representative photographs are shown. (A,B), Cells were cultured in GM and OM with or without IL‐33 (100 ng/mL). Results in graphs are presented as mean ± SEM from at least three independent experiment. Statistically significant differences in comparison with GM in the absence of IL‐33 (set as 1) by t test or in comparison with OM in the absence of IL‐33 according to t test: ***P < 0.001. (C,D), Cells were pretreated with IL‐33 (100 ng/mL) in GM during 7 d when the medium was replaced with OM and further grown for the appropriate time. Results in graphs are presented as means ± SEM of three different samples (n = 3) from at least three independent experiments, while as a control untreated OM (set as 1) was used. Statistically significant difference in comparison with IL‐33 pretreated GM according to t test: ***P < 0.001