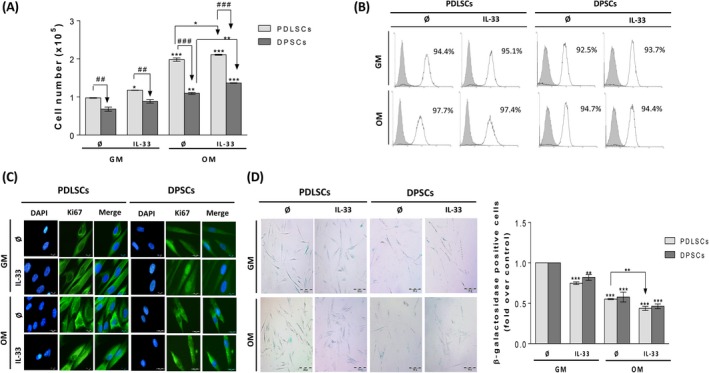
Figure 4.

Proliferation, Ki67 expression and β‐galactosidase staining in PDLSCs and DPSCs cultivated in GM and OM in the presence of IL‐33. Cells were grown until confluency and afterwards in GM or OM during 7 d in the presence or absence of IL‐33 (100 ng/mL). A, Proliferation of PDLSCs and DPSCs determined by Trypan blue. Results in graphs are presented as means ± SEM of four different samples (n = 4) from at least three independent experiments. Statistically significant differences in comparison with GM in the absence of IL‐33 by t test: *P < 0.05; **P < 0.01; ***P < 0.001; or in comparison with OM in the absence of IL33: *P < 0.05; **P < 0.01; or between PDLSCs and DPSCs: ## P < 0.01; ### P < 0.001 B, Flow cytometric detection of proliferation‐associated protein Ki67. Representative histograms showing the percentage of Ki67‐positive cells (empty peaks) in comparison with unstained cells as negative control (grey peaks) C, Cellular localization of Ki67 determined by immunofluorescence (Scale bars: 20 µm). DNA was stained with DAPI. D, Detection of single β‐galactosidase‐positive cells. Representative photographs are shown (Scale bars: 200 μm). E, Number of single β‐galactosidase‐positive cells counted per 2000 cells/well in 96‐well plate. Results in graphs are presented as mean ± SEM of three different samples (n = 3) from at least three independent experiments. Statistically significant differences in comparison with GM in the absence of IL‐33 control (set as 1) by t test: **P < 0.01; ***P < 0.001; or in comparison with OM in the absence of IL‐33: **P < 0.01.
