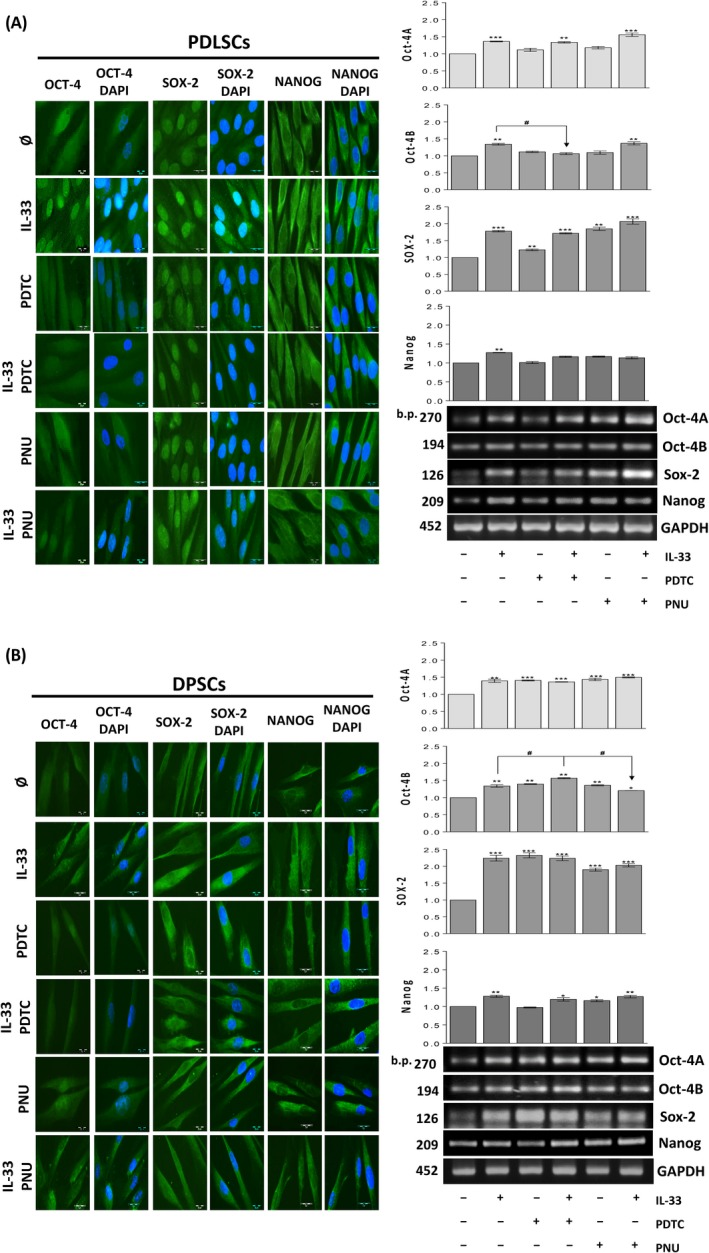
Figure 7.

Involvement of IL‐33‐modified NF‐κB and β‐catenin signalization in pluripotency marker expression. (A,B), cells were grown in GM during 7 d in the presence or absence of IL‐33 (100 ng/mL) with or w/o 2 µM PDTC and 5 µM PNU. Inhibitors were added in cell culture 30 min prior to IL‐33. Expression of pluripotency‐related transcription factors: Oct4, SOX‐2 and NANOG detected by indirect immunofluorescence staining with FITC‐conjugated corresponding secondary antibodies (Scale bars: 20 µm). DNA was stained with DAPI. For mRNA analysis, and cells were cultivated in GM in the presence or absence of IL‐33 (100 ng/mL) with or w/o 5 µM PDTC and 2 µM PNU during 24 h. As a gel loading control, GAPDH was used. Representative gels are shown. Molecular weight standards are indicated in bp for PCR products. Results in graphs represent relative gene expression of indicated gene and are shown as mean ± SEM of three different samples (n = 3) from at least three independent experiments. Statistically significant differences in comparison with control (untreated cells, set as 1) by t test: *P < 0.05; **P < 0.01; ***P < 0.001; or in comparison with IL‐33 treatment: # P < 0.05
