
Figure 4.
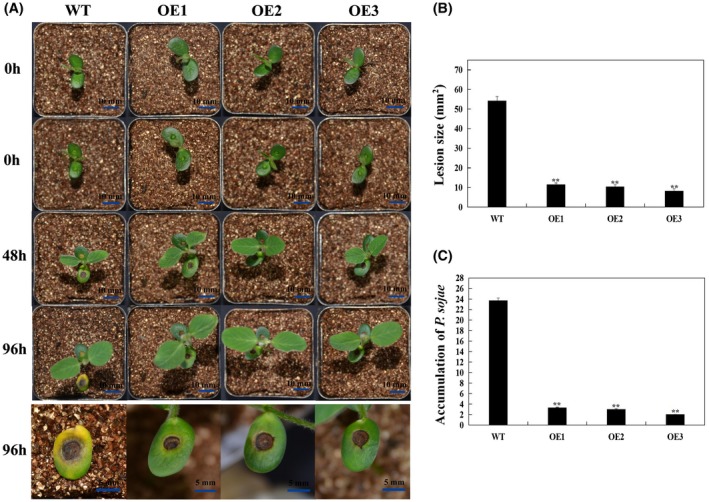
GmBTB/POZ enhances resistance to Phytophthora sojae in transgenic soybean cotyledons. (A) Disease symptoms on living cotyledons of GmBTB/POZ‐overexpressing (GmBTB/POZ‐OE) and wild‐type (WT) plants at 96 h after inoculation with P. sojae. (B) Lesion size measured from photographed cotyledons of GmBTB/POZ‐OE transgenic and WT plants at 96 h post‐inoculation (hpi). The lesion size of each independent soybean line (n = 3) was calculated, and the lesion sizes are shown in the columns based on a comparison with the average lesion area on WT soybean. (C) Quantitative reverse transcription‐polymerase chain reaction (RT‐PCR) analysis of the relative biomass of P. sojae in GmBTB/POZ transgenic lines and WT soybean based on P. sojae TEF1 transcript levels. The experiment was performed on three biological replicates, each with three technical replicates, and statistically analysed using Student’s t‐test (*P < 0.05, **P < 0.01). Bars indicate the standard error of the mean. [Color figure can be viewed at wileyonlinelibrary.com]