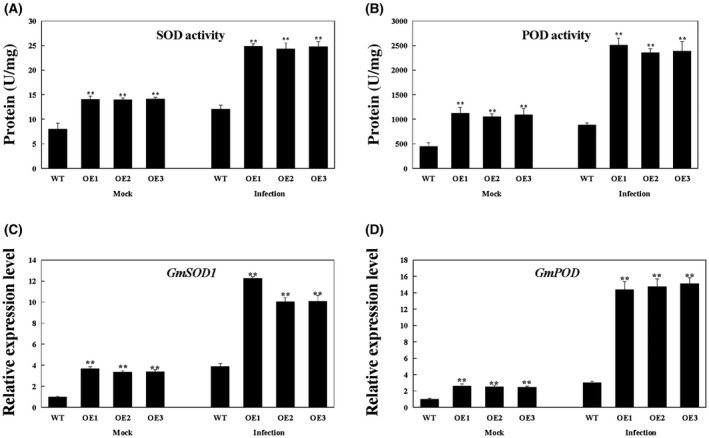
Figure 6.

Analysis of antioxidant enzyme activity (A, B) and the relative expression of genes (C, D) under mock treatment and infected by Phytophthora sojae at 24 h post‐inoculation (hpi). The activity of the control sample [mock‐treated wild‐type (WT) plants] was set to unity. The experiment was performed on three biological replicates, each with three technical replicates, and statistically analysed using Student’s t‐test (*P < 0.05, **P < 0.01). Bars indicate the standard error of the mean. POD, peroxidase; SOD, superoxide dismutase.
