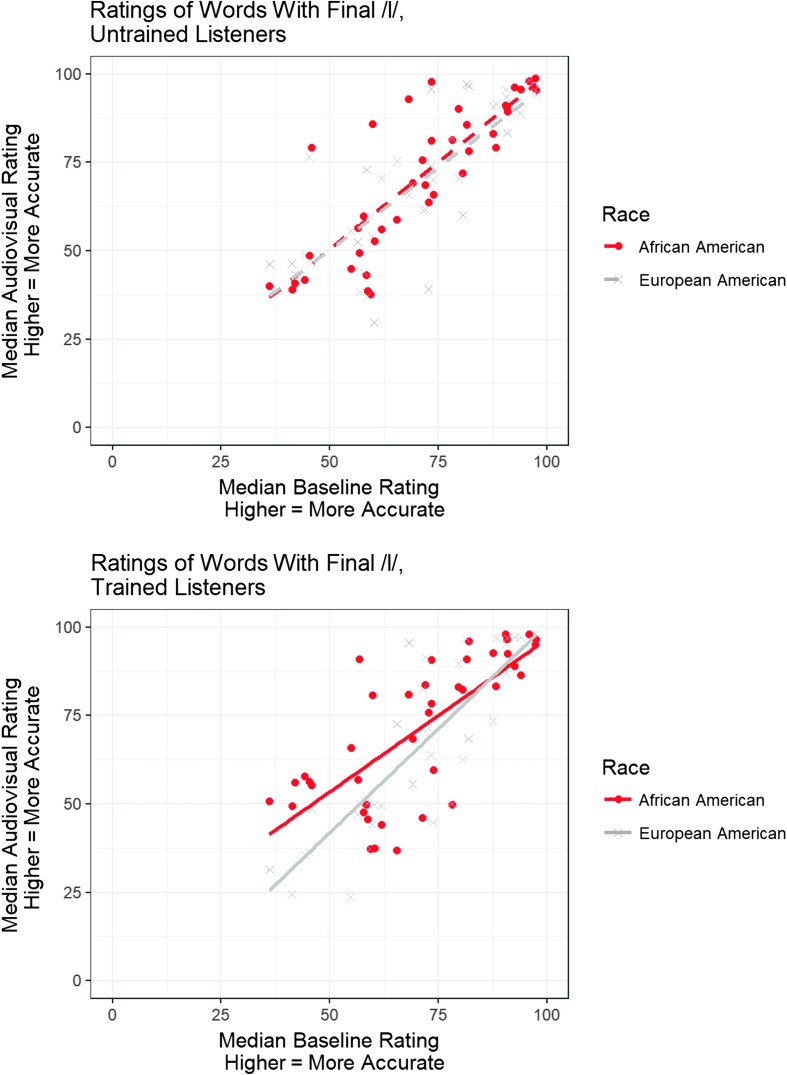
Figure 3.
Median ratings for the 40 stimuli that ended in /l/, separated by whether they were presented with an African American child's face (red circles, red regression line) or a European American child's face (gray crosses, gray regression line). Untrained listeners are plotted on the top figure (dashed regression lines), and trained listeners (solid regression lines) are plotted on the bottom.

