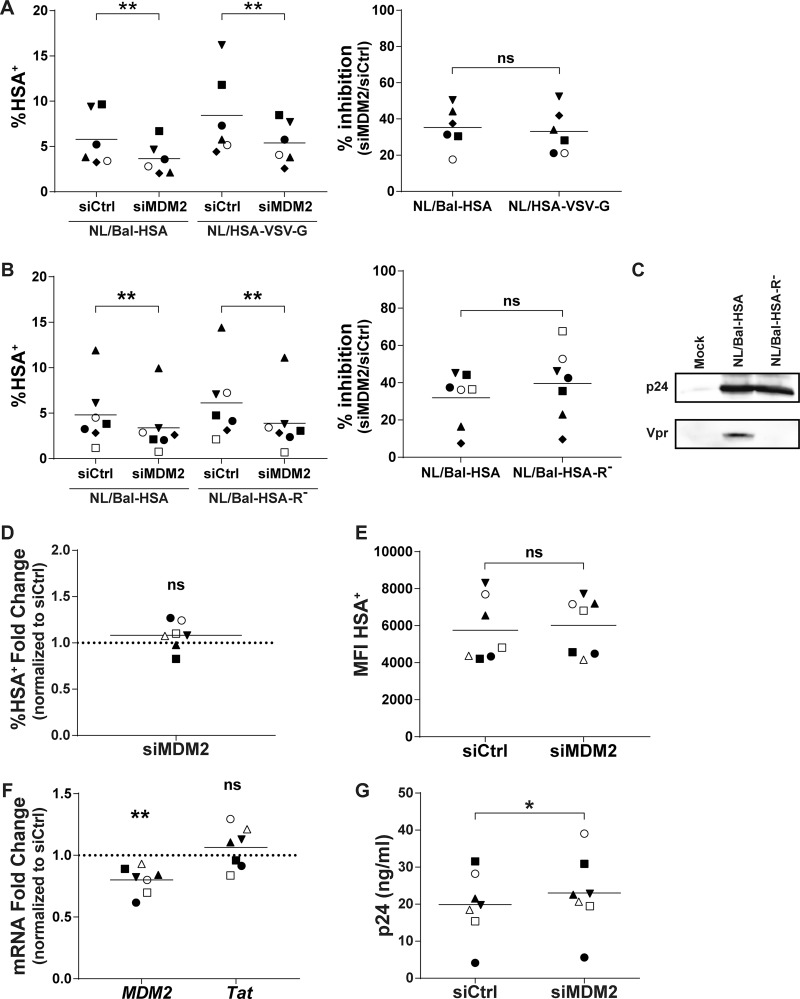
FIG 2.
MDM2 gene silencing in MDMs does not affect HIV-1 entry or viral gene expression. (A and B) MDMs from distinct donors were transfected with siCtrl or siMDM2 and then infected for 3 days with NL/Bal-HSA, NL/HSA-VSV-G, or NL/Bal-HSA-R−. The line represents the mean number of biological replicates for each condition. Each symbol represents an independent donor. The percentage of HSA+ MDMs (left) and the calculated percentage of inhibition (right) are shown for cells infected either with NL/Bal-HSA and NL/HSA-VSV-G (n = 6) (A) or NL/Bal-HSA and NL/Bal-HSA-R− (n = 7) (B). (C) HEK293T cells were transfected with pcDNA3.1(-) (mock), NL4.3-Bal-IRES-HSA, or NL4.3-Bal-IRES-HSA-R− with the calcium-phosphate precipitation method for 2 days. Proteins were extracted and analyzed by Western blotting for p24 and Vpr expression. (D to G) MDMs from 7 different donors were infected for 3 days and then transfected for 2 days with siCtrl or siMDM2. Each symbol represents an independent donor and is conserved between panels. The line represents the mean number of biological replicates for each condition. When data are normalized, the dotted line represents the control. (D) Flow cytometry analysis of MDMs productively infected with HIV-1 on the basis of HSA surface expression. (E) Flow cytometry analysis of the MFI for HSA+ MDMs. (F) qRT-PCR analysis of MDM2 and Tat mRNA expression at 2 days posttransfection. (G) Quantification of the p24 content in cell-free supernatants from transfected and infected MDMs by p24 ELISA. Statistical analyses were performed using the ratio-paired Student's t test (A, B, D, E, and G) and paired Student's t test (F) (ns, nonsignificant; *, P ≤ 0.05; **, P ≤ 0.01).

