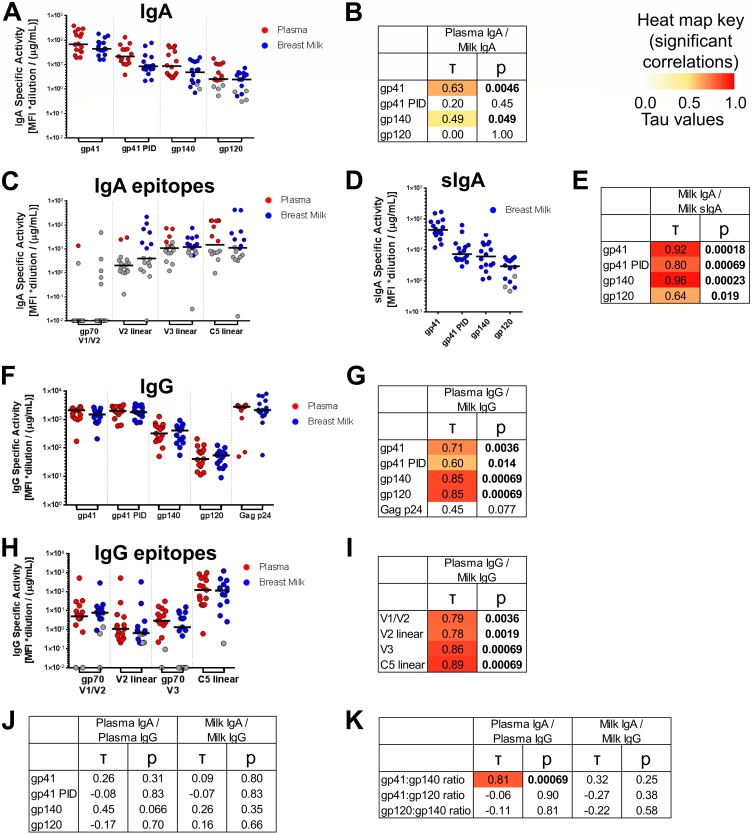
FIG 1.
Env antigen specificities of milk IgG and IgA and plasma and milk IgAs do not correlate, while milk and plasma IgG Env antigen-specificities are strongly correlated. (A, C, D, F and H) For 16 HIV-1+ lactating women, milk and plasma samples were obtained, and IgA and IgG were purified from both sample types. For IgA (A) and sIgA (D), binding scores to gp41, gp41 PID, gp140, and gp120 antigens are shown (see Materials and Methods for antigens and calculation). For IgA, scores for binding to gp70 V1/V2, linear V2, linear V3, and linear C5 antigen subspecificities are also shown (C). For IgG, scores are shown for binding to Env gp41, gp41 PID, gp140, and gp120, as well as Gag p24 antigens (F), and to gp70 V1/V2, linear V2, gp70 V3, and linear C5 antigen subspecificities (H). Background-subtracted MFI values below 0 are shown with a value of 0.01. (B, E, G, I, J and K) Correlations between compartments for each antigen specificity or antigen specificity ratio. Kendall’s tau values and corresponding corrected P values (see Materials and Methods) are reported. Boldface P values indicate significant correlations at a P value of <0.05, with corresponding tau values color coded on a scale of 0 to 1.

