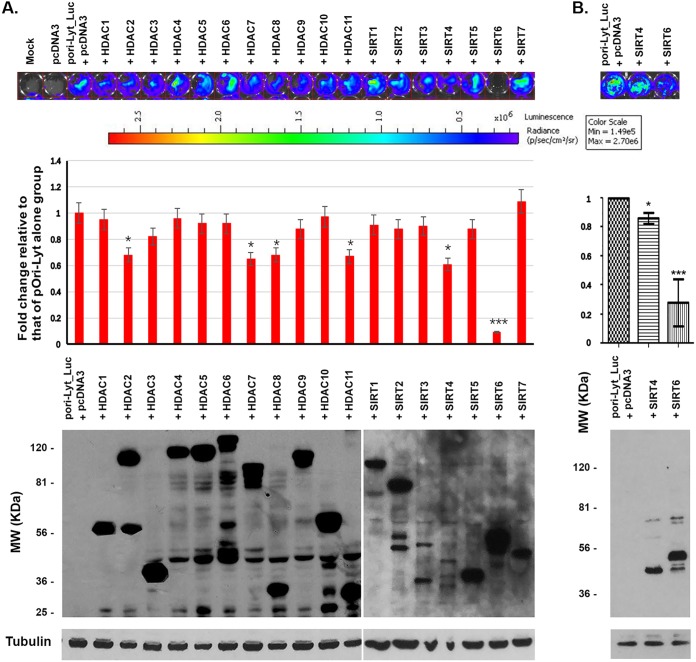
FIG 1.
Luciferase assay to screen the effects of HDACs and SIRTs on the promoter activity of ori-Lyt. The ori-Lyt-driven luciferase plasmid was cotransfected with the vector (pcDNA3) or HDAC- or SIRT-expressing plasmid into HEK293T cells for 24 h. Then, the cells were applied to an IVIS imaging system to examine the luciferase activities. (A) (Top) The IVIS system was used to visualize the signal and take photos. The depth of the color correlates with the strength of luciferase activity. (Middle) The activities quantitated from three independent experiments were statistically averaged and compared to the activities of the pori-Lyt-luc and pcDNA3 groups. The fold change is shown. (Bottom) Whole-cell lysate samples were collected after luciferase assay, and Western blotting was performed to detect the expression of HDACs and SIRTs. (B) Luciferase assay to compare the suppressive effects on the promoter activity of ori-Lyt between SIRT6 and SIRT4. p/sec/cm2/sr, number of photons per second per square centimeter per steradian; MW, molecular weight.

