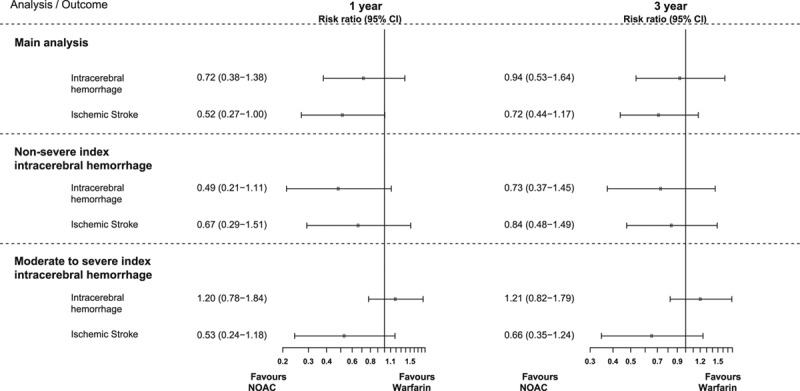
Figure 3.

Forest plot of inverse probability treatment weighted risk ratios contrasting non–vitamin K antagonist oral anticoagulants (NOACs) vs warfarin (reference) and associated outcomes under different analytic approaches.

Forest plot of inverse probability treatment weighted risk ratios contrasting non–vitamin K antagonist oral anticoagulants (NOACs) vs warfarin (reference) and associated outcomes under different analytic approaches.