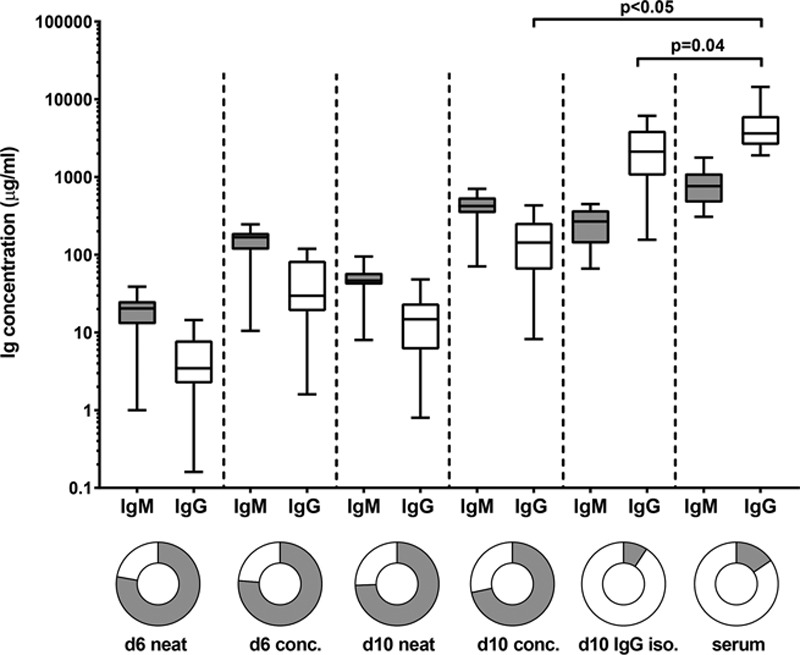
FIGURE 2.

IgG isolation from culture supernatants results in IgM/IgG ratios similar to serum samples. IgM and IgG concentrations in neat (d6 and d10), concentrated (d6 and d10) and IgG isolated (d10) supernatants as well as serum samples (n = 16 [re-tx n = 9, multiparous n = 2 and alloantigen nonexposed n = 5]). Gray bars represent IgM, white bars represent IgG. d6 conc, day 6 concentrated; d10 conc, day 10 concentrated; d10 IgG iso, day 10 IgG isolated; re-tx, repeat transplantation.
