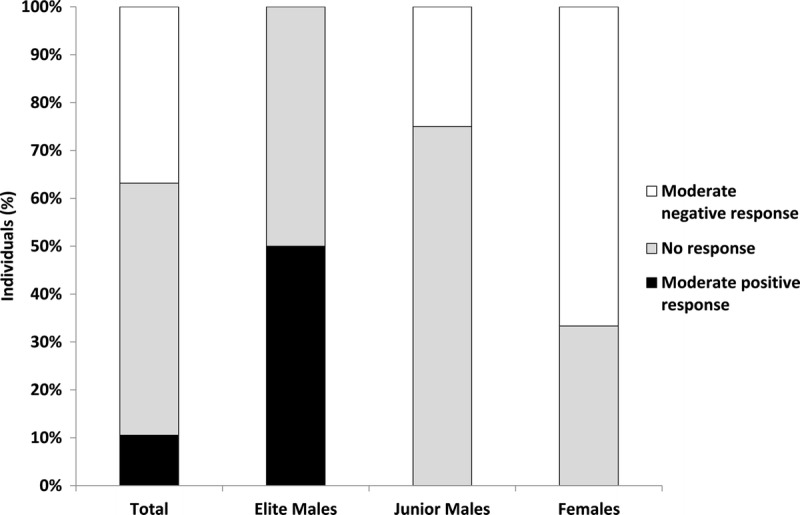
FIGURE 2.

Individual response analysis with respect to DP vs CLASSIC in the total group and the three subgroups. Percent differences are categorized as nonresponse, <3% or >−3% difference; moderate positive response in favor of DP, 3% to 9%; moderate negative response in favor of CLASSIC, −3% to −9%.
