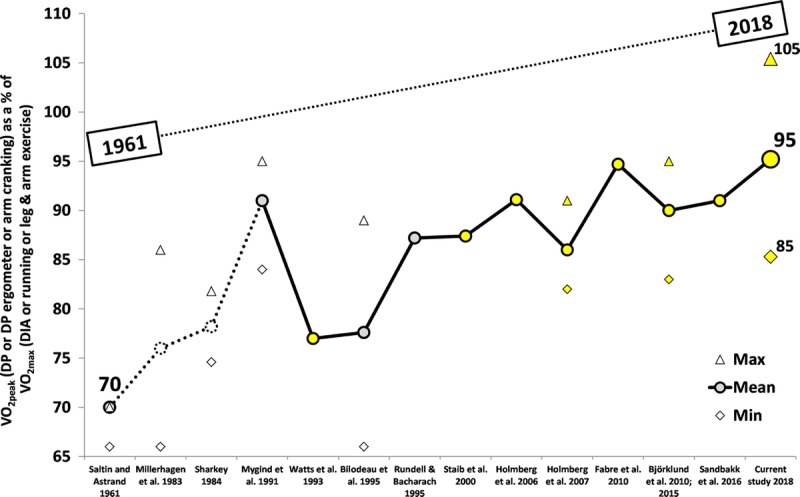
FIGURE 4.

Development of the V˙O2peak with DP or upper-body exercise (e.g., arm cranking, pulley exercises or on DP ergometers) in comparison to the V˙O2max during whole-body exercise (e.g., treadmill running, or arm and leg cycling, or treadmill roller skiing with DIA). The bold line represents the group mean and the scattered line the range of the values reported. The yellow circles represent studies where DP V˙O2peak was compared directly to DIA V˙O2max, and the white circles represent the calculated mean of the minimal and maximal values in this study. The values were either taken directly from the original publications or recalculated from the individual data reported (15–17,24,26–34).
