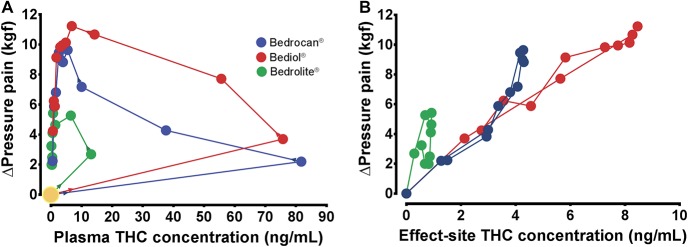
Figure 5.
(A) Plasma THC concentration (CP) vs the change in pressure pain threshold after treatment with Bedrocan (blue dots), Bediol (red dots), and Bedrolite (green dots). The arrows indicate the direction of effect, starting at the large yellow circle. (B) Estimated steady-state or effect-site (CE) concentration vs the change in pressure pain threshold for the 3 active cannabis varieties. THC, tetrahydrocannabinol.

