FIGURE 2.

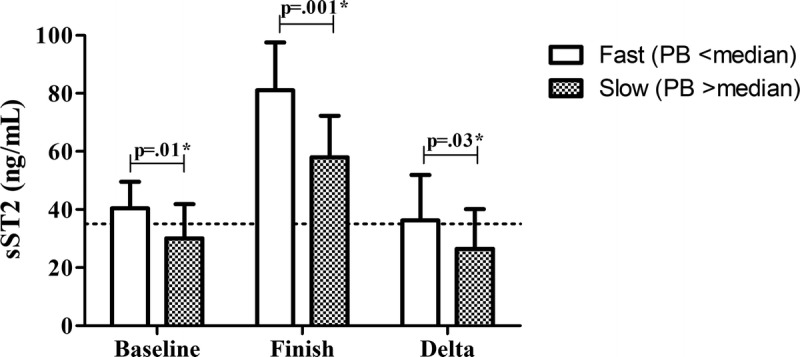
sST2 concentrations in the fastest 50% vs slowest 50% of the cohort based on marathon personal best time. Dotted line shows the cutoff value for sST2 (35 ng·mL−1). Data are shown as median with interquartile range.

sST2 concentrations in the fastest 50% vs slowest 50% of the cohort based on marathon personal best time. Dotted line shows the cutoff value for sST2 (35 ng·mL−1). Data are shown as median with interquartile range.