
Fig. 2. Predictive accuracy of ANN-ECG versus TB Hamiltonian.
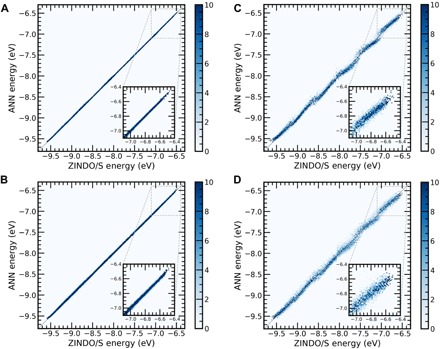
Two-dimensional (2D) histogram plots of ANN-ECG performance applied to the (A) 300 and (B) 500 K/rigid datasets and the TB model (Eq. 1) applied to the (C) 300 and (D) 500 K/rigid datasets. Color bar denotes the probability distribution of predicted HOMO energy levels, and the inset shows the prediction in the interval of the highest-energy HOMO.