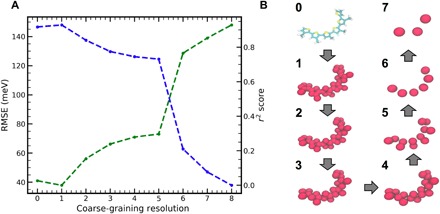
Fig. 4. ANN-ECG performance applied to a systematically reduced set of coarse-grained representations.

(A) ANN-ECG fivefold cross-validated RMSE (green) and r2 (blue) of 300 K/flexible S3MT configurations as a function of CG resolution. (B) Visualizations of the CG mappings for S3MT occurring at all resolutions shown in (A). Resolution 8 in (A) corresponds to one CG bead per S3MT molecule and is not explicitly shown.
