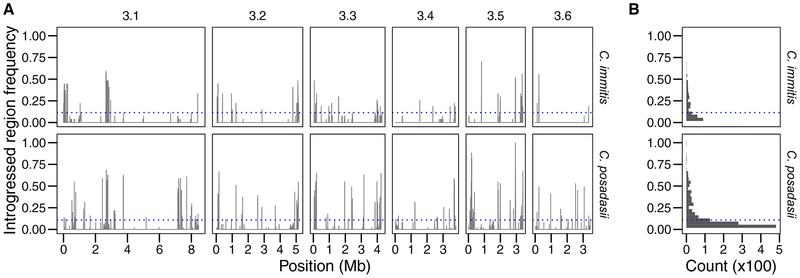
FIGURE 3. Genomic distributions of introgression tracts in the two species of Coccidioides.
A. Bars show the weighted allele frequency of introgressed tracts in the two recipient species. B. Histogram of the frequency of introgressed haplotypes into each species. Blue dotted line shows the mean allele frequency of introgressed alleles for C. immitis (0.141) and C. posadasii (0.169).

