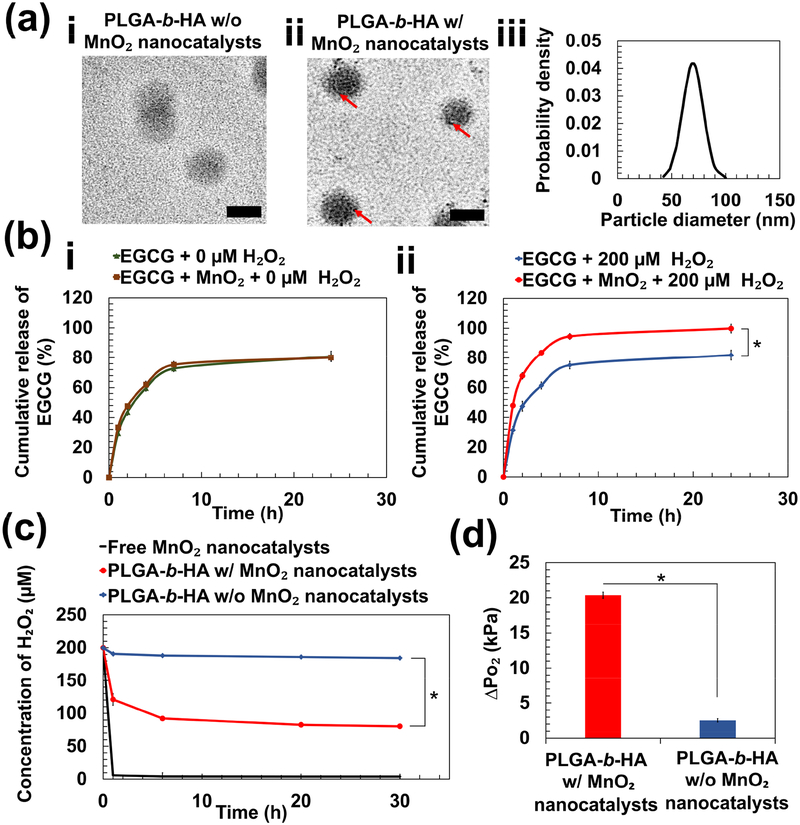
Figure 2:
Physical characterization of PLGA-b-HA particles containing EGCG and MnO2 nanocatalysts. (a) Transmission electron microscopic images of particles loaded with EGCG (a-i) and particles loaded with EGCG and MnO₂ nanocatalysts (a-ii). Red arrows indicate the existence of MnO₂ nanocatalysts. Scale bar = 50 nm. (b) Release profiles of EGCG over 24 h at 37 °C. EGCG-loaded particles with and without MnO2 nanocatalysts were immersed in either phosphate-buffered saline (PBS) (i) or PBS containing 200 μM H2O2 (ii). (c) The rate of change of H2O2 concentration in media containing free MnO2 nanocatalysts and particles with and without MnO2 nanocatalysts. (d) The increase in pressure of O₂ gas (ΔPO₂) at 24 h due to generation of O₂ from the decomposition of H2O2. The values and error bars represent the average values and standard deviation of three individual samples per condition, respectively. * represents the statistical significance of the difference of value for particles loaded with EGCG and MnO2 nanocatalysts in PBS containing 200 μM H2O2 and that for each of the three other conditions. (* p < 0.05).

