Figure 7:
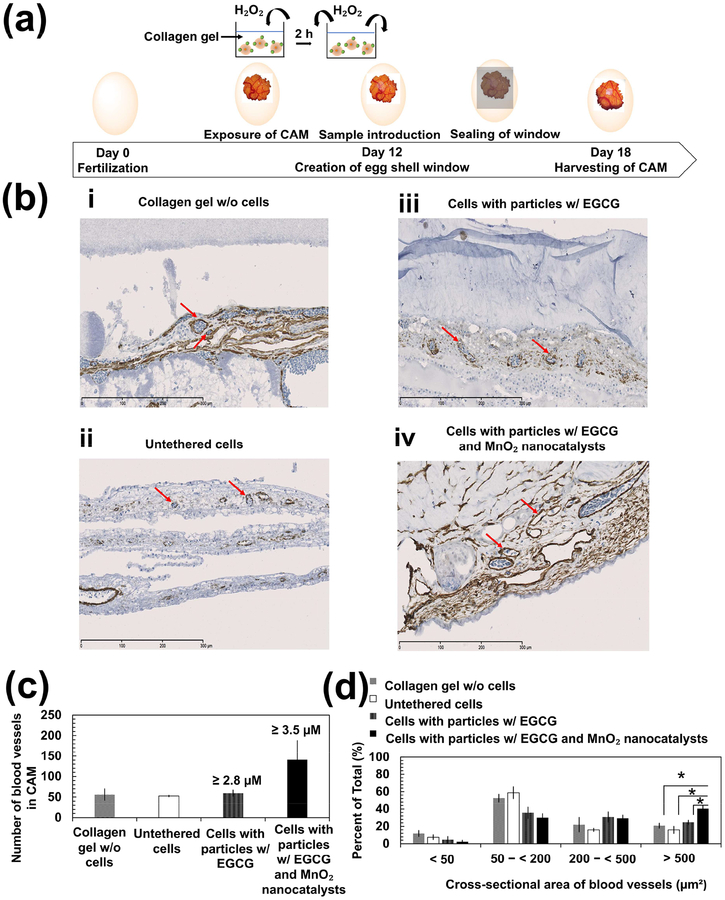
In vivo chick chorioallantoic membrane (CAM) angiogenesis assay. (a) Schematic illustration of CAM assay. Eggshell was opened to expose CAM following 12 days of fertilization. Mesenchymal stem cells seeded within collagen gels were incubated in media containing 200 μM H2O2 for 2 h before implantation onto the CAM. The eggs were incubated for 6 days prior to harvesting the CAM. (b) Immunohistological analysis of the harvested CAM with an antibody to α-smooth muscle actin (red arrows). Images b-i, b-ii, b-iii, and b-iv represent cross-sections of CAM implanted with the collagen gel containing no stem cells, the collagen gel encapsulating untethered stem cells, the collagen gel encapsulating stem cells tethered with particles containing EGCG only, and the collagen gel encapsulating stem cells tethered with particles loading EGCG and MnO2 nanocatalysts, respectively. Scale bar = 300 μm. (c) Quantification of the total number of blood vessels shown in the cross-sectional area of CAM where the sample was implanted on. The numerical values indicated above the bars are the estimated amount of EGCG released from the particles. The amount of EGCG released was estimated using the in vitro release profile of EGCG obtained in Figure 1b. The initial loading of EGCG was 3.5 μM. (d) Quantification of the percentage of the number of blood vessels in the respective range of cross-sectional area with respect to the total number of blood vessels in the CAM. The values and error bars represent the average values and standard deviation from six to seven different regions of CAM per condition, respectively. * represents the statistical significance in the difference of values between the indicated conditions (* p < 0.05).

