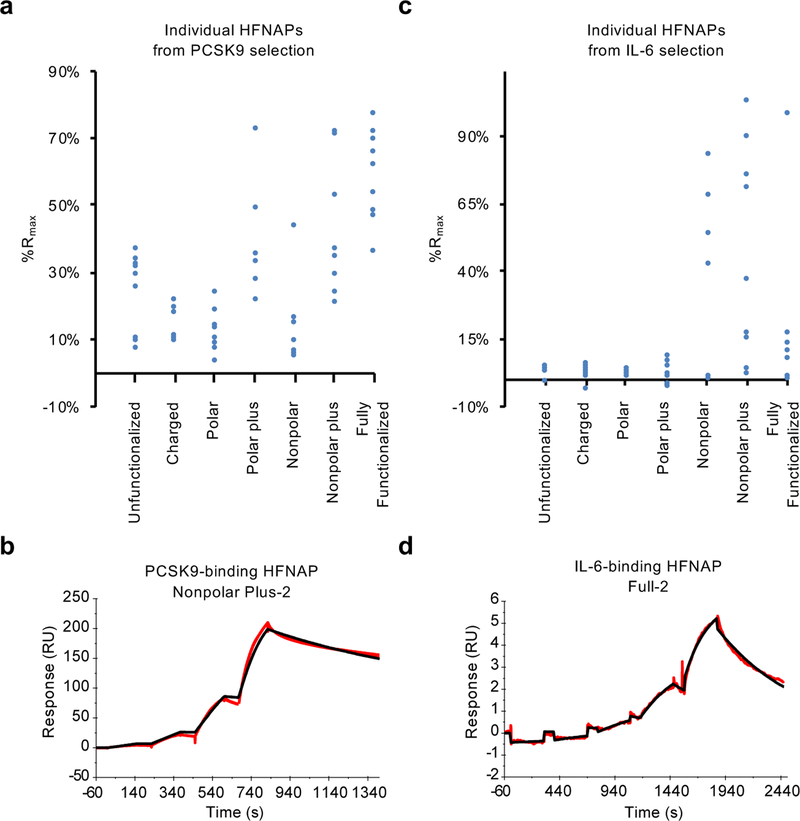
Figure 4: Target-binding activity of individual HFNAPs by SPR.
a, Observed %Rmax for individual polymers emerging from iterated cycles of translation and selection for binding to PCSK9, calculated from SPR response following a single injection of 60 nM PCSK9. b, Background-subtracted sensorgram (red) of PCSK9-binding HFNAP Nonpolar Plus-2 binding to 10, 30, 100, and 300 nM PCSK9 and curve fitting with a 1:1 binding model (black) results in an apparent Kd of 28 nM (shown); the average among three replicates is Kd = 11±14 nM (see Methods). c, Observed %Rmax for individual polymers emerging from iterated cycles of translation and selection for binding to IL-6, calculated from SPR response following the third of four injections of IL-6 in a single-cycle kinetics assay (8.9, 27, 80, and 240 nM IL-6; see Methods for details). d, Background-subtracted sensorgram (red) of IL-6-binding polymer Full-2 binding to 0.3, 1, 3, 10, and 30 nM IL-6 and fitting with a 1:1 binding model (black) results in an apparent Kd of 12 nM (shown); the average among three replicates is Kd = 5.3±5.9 nM, although we note that this polymer exhibits complex binding behavior at concentrations above 30 nM. Kd values represent mean ± standard deviation (n = 3).

