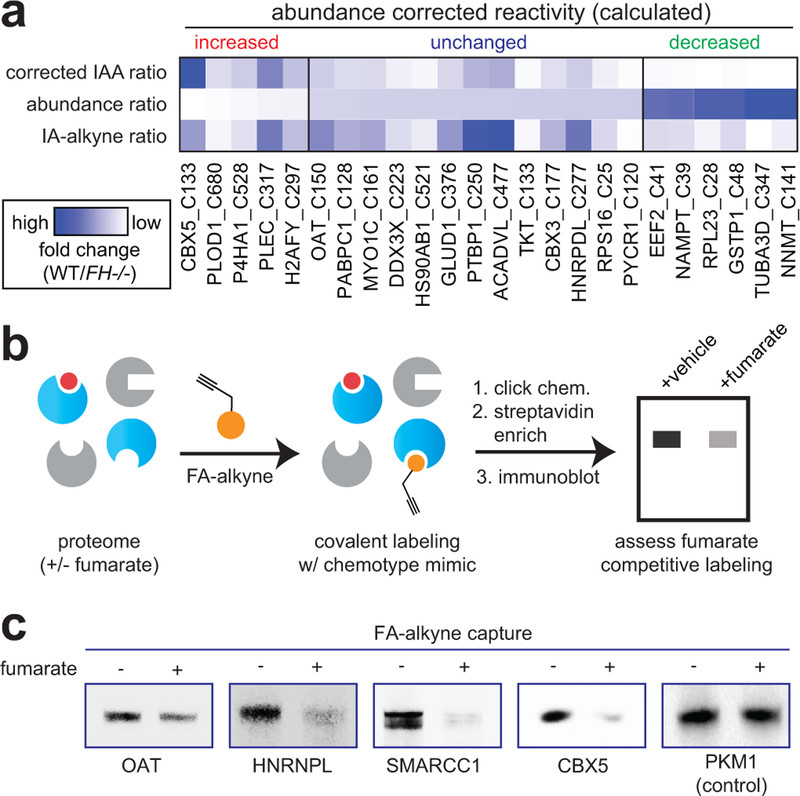
Figure 3.
Analyzing the reactivity and abundance of FH-regulated cysteines. (a) Heat map illustrating strategy for correcting Cys reactivity ratios measured in UOK262 (FH-deficient) and UOK262WT (FH rescue) cells using whole proteome MudPIT LC-MS/MS data. Adjusting for protein abundance can lead to an increase in calculated reactivity (left protein subset, red), an insignificant change (middle protein subset, blue), or a decrease in calculated reactivity (right protein subset, green). An extended graphic of protein families harboring high confidence, abundance-corrected FH-regulated cysteine residues is provide in Supplementary Fig. 2d. (b) Validating FH-regulated Cys residues using the clickable chemotype mimic FA-alkyne. (c) FA-alkyne capture of proteins that contain FH-regulated Cys residues is competed by fumarate (3 h pre-incubation with 1 mM fumarate; then 15 h treatment with 100 μM FA-alkyne). Representative images from two independent experiments are shown. Uncropped scans of immunoblots are provided in Supplementary Fig. 10.

