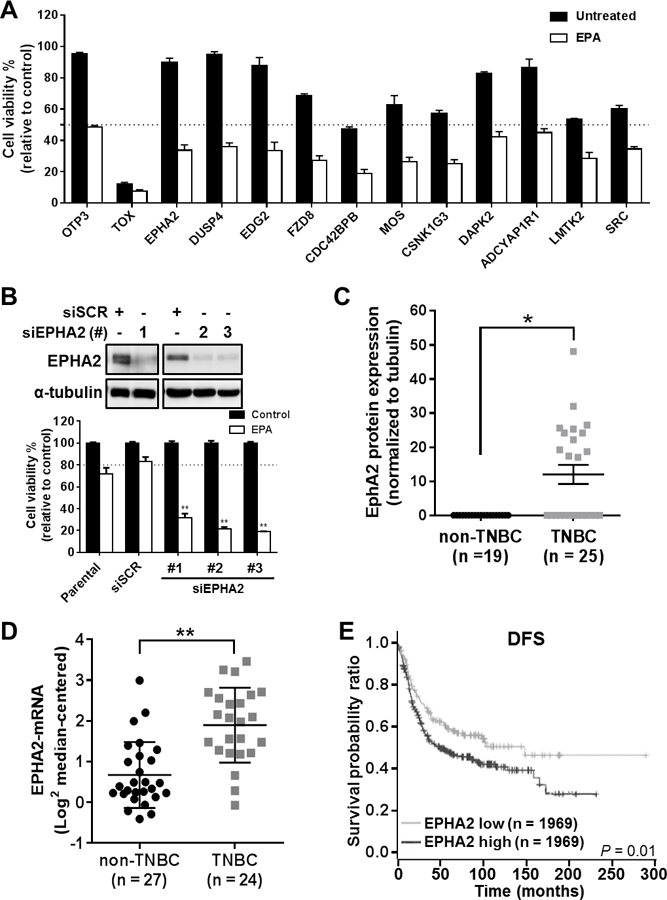
Figure 2. EPHA2 is a clinically significant target that enhances TNBC cell sensitivity to EPA.

(A) Cell viability readout for the 12 most significant gene siRNAs for sensitizing SUM149PT cells to EPA, identified by high-throughput siRNA synthetic-lethal functional screen. TOX and OTP3 were used as positive and negative transfection controls, respectively. EPHA2 was identified as a top candidate for sensitizing TNBC cells to EPA therapy. (B) EPHA2 inhibition was validated in the cells by immunoblotting analysis with anti-EPHA2 antibody (top) after transfection with three different EPHA2 siRNAs (#1–3) or scrambled control siRNA (siSCR). The effects of EPHA2 inhibition in these cells and in parental (untransfected) cells, alone or in combination with EPA treatment, were confirmed by viability assays (bottom). Data were pooled from three independent experiments and are presented as mean ± SD. (C) EPHA2 protein expression levels were compared in TNBC and non-TNBC cell lines by a capillary-based immunoassay (Simple Western™). The chemiluminescent signal for EPHA2 protein expression was normalized with the signal for tubulin protein expression for each cell line, and these ratios were used to generate the graph; tubulin expression was used as a protein loading control. The mean ± SEM is indicated. (D) EPHA2 mRNA expression levels extracted from a previously published dataset of breast cancer cell lines 12 were compared for TNBC and non-TNBC cell lines. The mean ± SD is indicated. Differences between groups were compared by unpaired t-test: *, P < 0.001; **, P < 0.0001. (E) Kaplan-Meier survival curves were generated for disease-free survival (DFS) of patients with TNBC/basal-like breast cancer classified by EPHA2 mRNA levels in tumors. Data were extracted from the BreastMark mRNA dataset. The log-rank test was used to compare survival curves for high (above median) versus low EPHA2 expression. The initial numbers of patients at risk in each group are indicated in the key.
