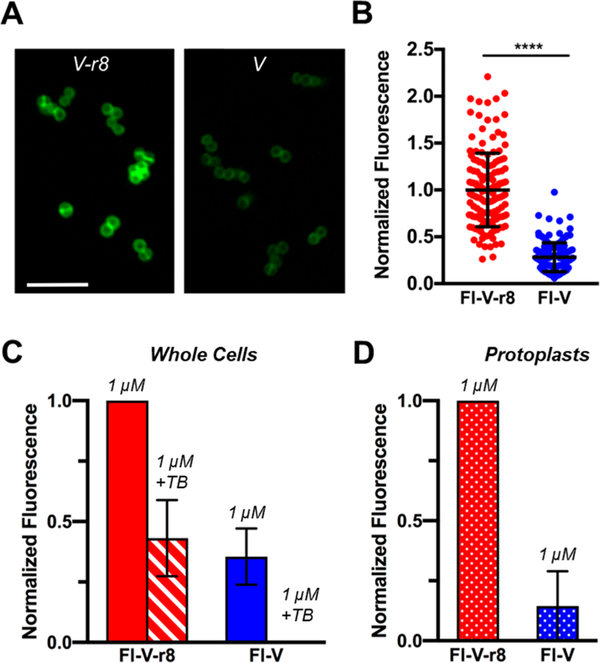
Figure 2.
MRSA USA400 MW2 bacteria treated with Fl-V–r8 exhibits greater cell-associated and protoplast-associated fluorescence than Fl-V. (A) Confocal microscopy of bacteria treated with 5 μM FlV–r8 for 5 min and (B) analysis of fluorescence intensities of individual bacteria imaged as in (A). Intensity values were normalized to the mean intensity of Fl-V–r8-treated cells. Error bars represent standard deviations. P < 0.0001 determined using a Mann–Whitney test. (C) FACS analysis of MRSA whole cells treated with Fl-V–r8 or Fl-V. (D) FACS analysis of protoplasts prepared from MRSA whole cells treated with Fl-V–r8 and Fl-V as in (C). In (C) and (D), each bar represents median normalized fluorescence values from two experiments, with data normalized to the highest fluorescence value in each experiment. Error bars represent the range of normalized fluorescence values obtained in two experiments.

