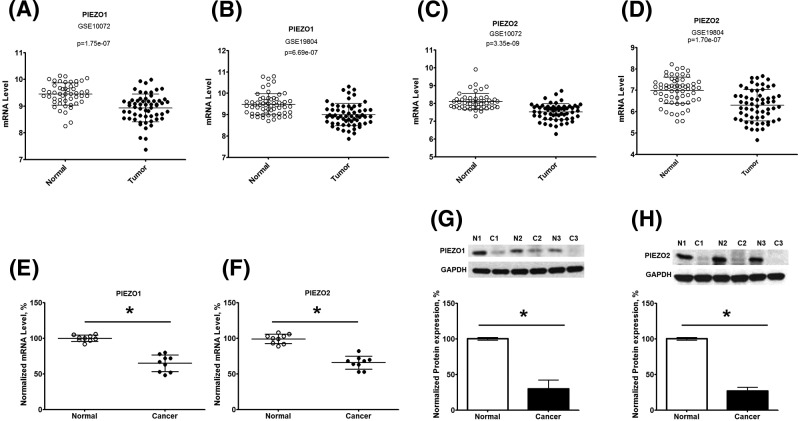
Figure 1. Expression of PIEZO1 and 2 in normal and tumor tissues from human NSCLC patients.
mRNA and protein expression of PIEZO1 and 2 in lung tumors was compared with the expression in adjacent normal tissues. (A,B) Expression levels of PIEZO1 in human lc tissues compared with normal tissues in GSE10072 (A) and GSE19804 (B). (C,D) Expression levels of PIEZO2 in human LC tissues compared with normal tissues in GSE10072 (C) and GSE19804 (D). (E,F) mRNA expression of PIEZO1 (E) and PIEZO2 (F) in cancer tissue and adjacent normal tissues from human NSCLC patients were collected from Jilin Hospital. The mRNA expression was analyzed by RT-qPCR, and normalized to the expression of GAPDH. (G,H) Protein expression of PIEZO1 (G) and PIEZO2 (H) in cancer tissue and adjacent normal tissues. Upper panel indicates the representative images of Western blot from cancer tissue (C1–C3) and adjacent normal tissues (N1–N3), and the lower panel shows the quantitation of protein expression (n=5). The normalized expression of PIEZO1 and PIEZO2 is displayed as mean ± S.D. *P<0.05.

