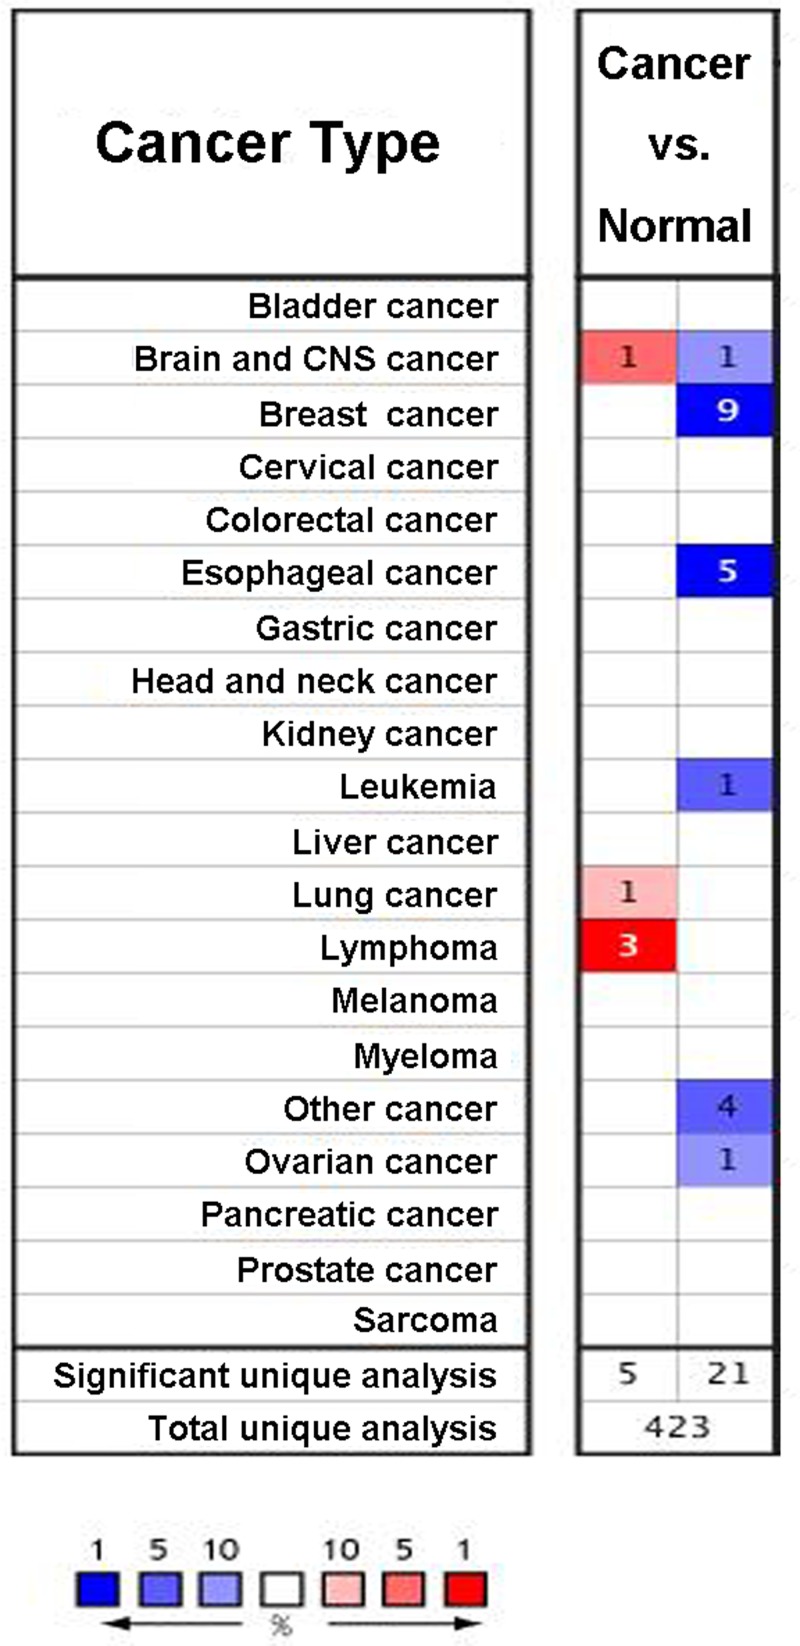
Figure 1. Expression of TRIM13 gene in 20 common cancers versus paired normal tissues using the Oncomine database with the threshold of fold change ≥2, P-value ≤1E-4, and gene rank ≥ top 10%.
Red and blue respectively stand for the numbers of datasets with statistically significant (P<0.05) increased and decreased levels of TRIM13 gene.

