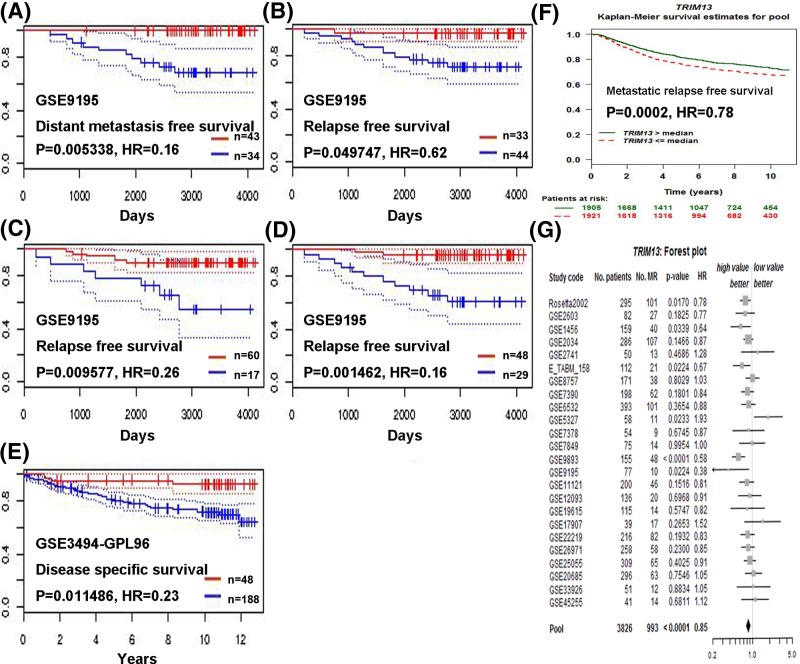
Figure 4. Survive curve and forest plot evaluating the prognostic value of TRIM13 using the PrognoScan and bc-GenExMiner database.
Analysis is shown for distant metastasis free survival (A), relapse free survival for different probe (B–D), disease specific survival (E), metastatic relapse free survival (F), and forest plot (G). For A–E, red and blue stand for high and low expression of TRIM13 gene, respectively.

