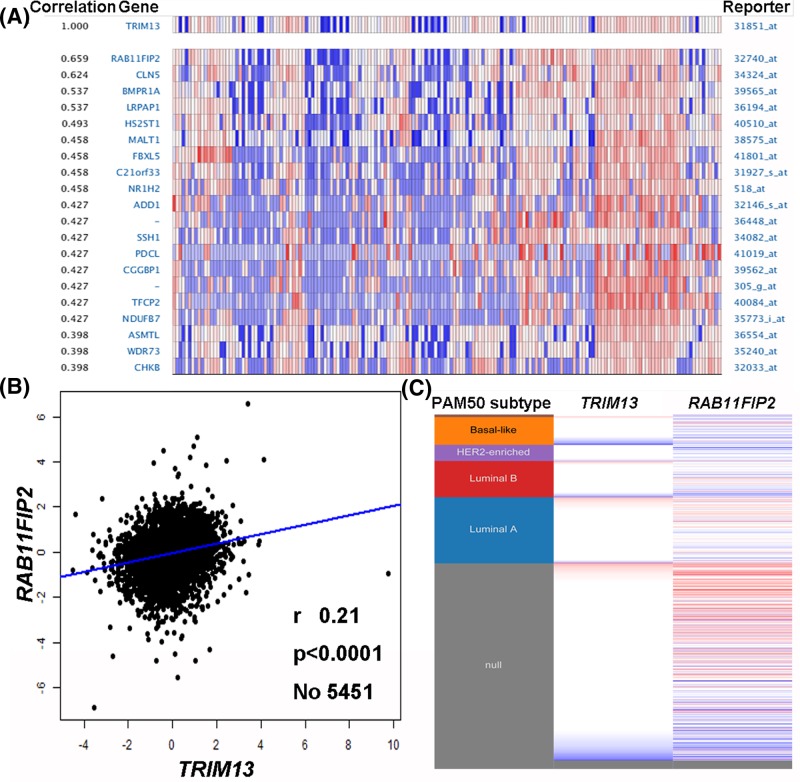
Figure 5. Co-expression of TRIM13 gene.
(A) TRIM13 co-expression of genes identified using the Oncomine database. (B) Correlation between TRIM13 and RAB11FIP2 expression in breast cancer analyzed using the bc-GenExMiner software. (C) Heat map of TRIM13 and RAB11FIP2 expression across a 50-gene qPCR assay (PAM50) breast cancer subtypes in the TCGA database generated using the UCSC Xena web-based tool.

