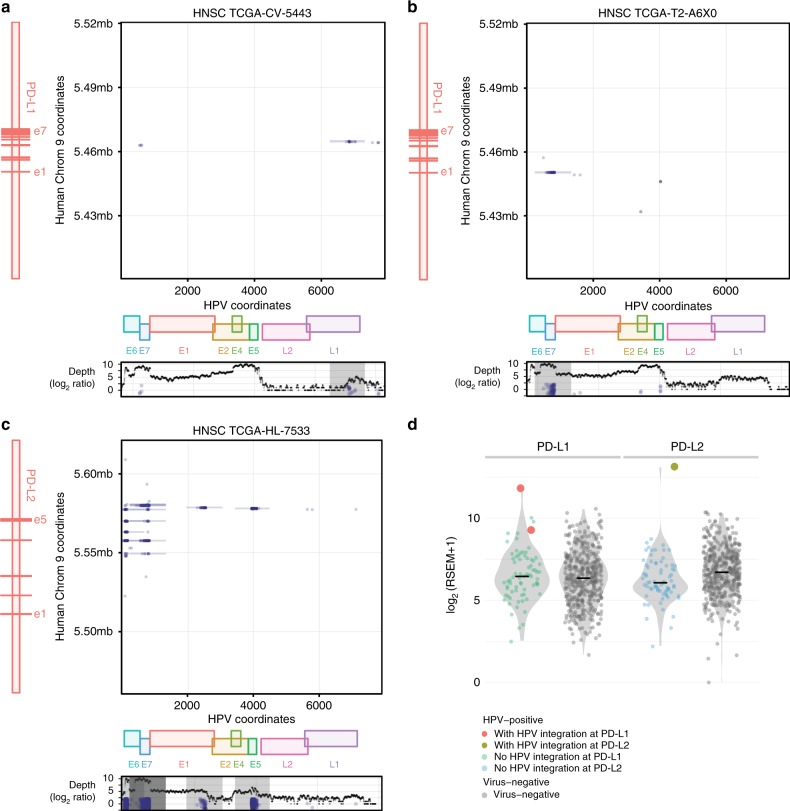
Fig. 1.
HPV integrations at PD-L1 and PD-L2. a–c Structural analysis of HPV integration events at PD-L1 or PD-L2 for three different HNSC tumors. The dots in the plot show the coordinates in HPV genome (X) and human chromosome (Y) of the breakpoints67. The vertical line represents a series of breakpoints clustered together by Pindel66. In the figure, e1 represents exon 1. HPV integrates intron 4 and 5′ UTR of PD-L1 in tumor TCGA-CV-5443 and TCGA-T2-A6X0, respectively. In tumor TCGA-HL-7533, HPV can integrate multiple locations in or after intron 3 of PD-L2. The bottom panel shows the number of mapped HPV reads (log2 ratio) along with HPV coordinates and E6, E7, E1, E2, E4, E5, L2, and L1 are different genes in HPV genome. d The expression of PD-L1 or PD-L2 for HPV-positive samples with and without HPV integrations and virus-negative tumors

