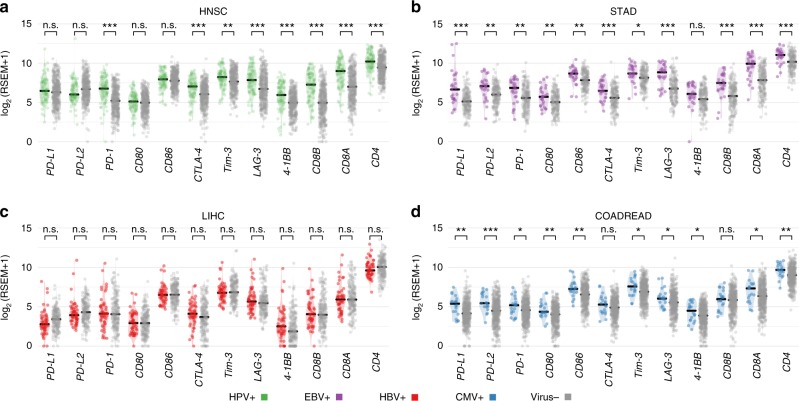
Fig. 2.
Expression of immune checkpoint genes in virus-positive and negative tumors. The comparison of the expressions of immune checkpoint genes PD-L1, PD-L2, PD-1, CD80, CD86, CTLA-4, Tim-3, LAG-3, and 4-1BB as well as T-cell CD4 and CD8 markers for a HPV-positive and virus-negative tumors in HNSC, b EBV-positive and virus-negative tumors in STAD, c HBV-positive and virus-negative tumors in liver hepatocellular carcinoma and d Cytomegalovirus-positive and virus-negative tumors in colon and rectum adenocarcinoma. The “*”, “**”, and “***” symbols indicate p-value in the regions [0.05, 0.01], (0.01,0.001], and <0.001, respectively

