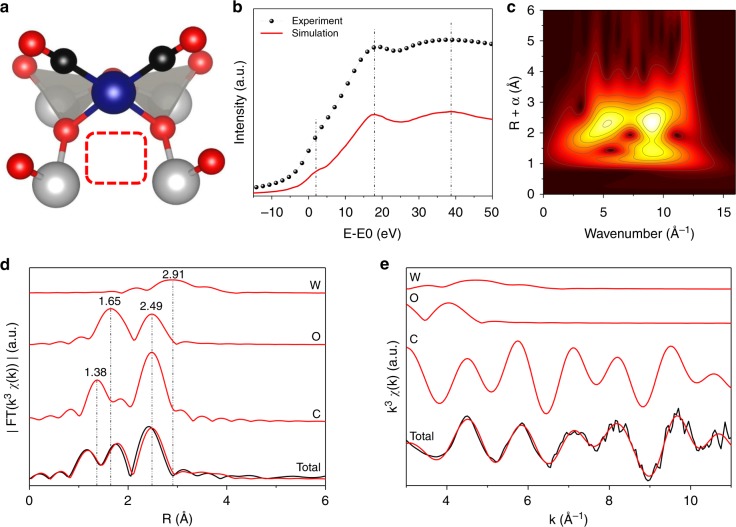
Fig. 2.
Spectroscopic evidence for the formation of an oxygen vacancy. a DFT-optimized structure of the catalyst with oxygen vacancy and two bound CO molecules. Atom colors: W (gray), O (red), C (black), Rh (blue). b best fit for the XANES simulation of the catalyst structure depicted in a; c Morlet wavelet transform of the catalyst after treatment under CO. d, e EXAFS analysis of structure (a) in d R and e k space. Curves from bottom to top are the experimental scattering contributions (black) superimposed with the total fitted scattering contributions, Rh–C, Rh–O, and Rh–W scatterings (all in red)

