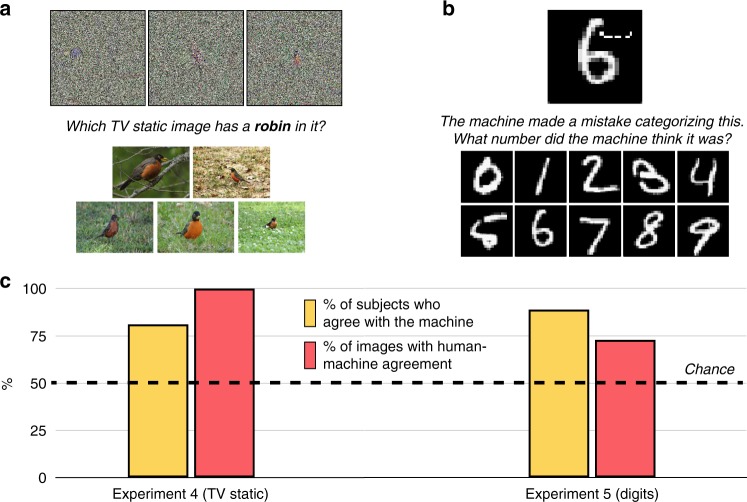
Fig. 3.
Classification with directly encoded fooling images and perturbed MNIST images. a In Experiment 4, 200 subjects saw eight directly encoded “television static” images at once (though only three are displayed here); on each trial, a single label appeared, along with five natural photographs of the label randomly drawn from ImageNet (here, a robin [and represented in this figure using public-domain images instead of ImageNet images]). The subjects’ task was to pick whichever fooling image corresponded to the label. b In Experiment 5, 200 subjects saw 10 undistorted handwritten MNIST digits at once; on each trial, a single distorted MNIST digit appeared (100 images total). The subjects’ task was to pick whichever of the undistorted digits corresponded to the distorted digit (aside from its original identity). c Most subjects agreed with the machine more often than would be predicted by chance responding, and most images showed human-machine agreement more often than would be predicted by chance responding (including every one of the television static images). For Experiment 4, the 95% confidence interval for the % of subjects with above-chance classification was [75.5% 87.3%], and [63.1% 100%] (one-sided 97.5% confidence interval) for the % of images with above-chance classification. For Experiment 5, these intervals were [84.2% 93.8%] and [64.3% 81.7%], respectively. Across both experiments, these outcomes were reliably different from chance at p < 0.001 (two-sided binomial probability test)

