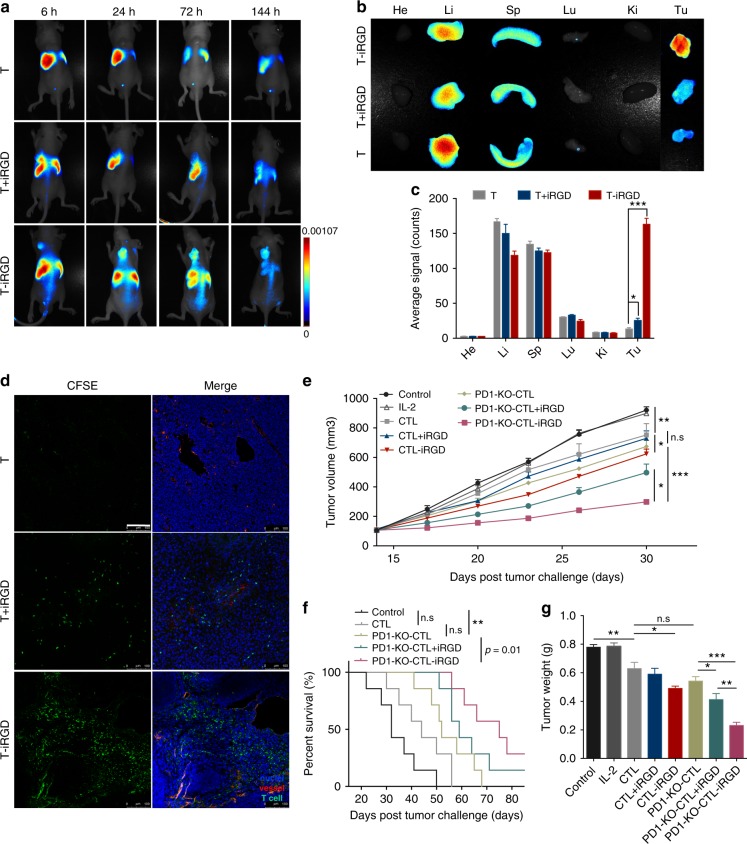
Fig. 3.
iRGD modification enhanced lymphocytes infiltration into tumor parenchyma in a systematic administration route and overcame resistance to PD-1 disruption immunotherapy. a In vivo imaging of HGC27 tumor-bearing mice at 6, 24, 72, and 144 h after intravenous injection of DiR-labeled T cells. White dashed lines, subcutaneous tumors. b Ex vivo imaging of tumors and other organs at 144 h after T cells transfusion. c Semiquantification of T cells biodistribution in mice organs collected at 144 h post-injection. Results are expressed as mean fluorescence intensity ± s.e.m.; n = 5. Student’s t test. **p < 0.01, ***p < 0.001. d Confocal imaging of frozen tumor sections at 24 h post T cells transfusion. T cells were labeled with CFSE before intravenous injection; tumor blood vessels were labeled with anti-CD31. T cells, green; vessel, red; nucleus, blue. Scale bar, 100 μm. e–g Enhanced antitumor effect of iRGD-modified PD-1-disrupted CTLs in a xenograft SNU719 mouse gastric tumor model. Tumor-bearing mice received different forms of treatment every 4 days for 3 times. Tumor growth profiles (e) and survival curve (f) of mice treated with PBS, IL-2, CTL, CTL + iRGD, CTL-iRGD, PD-KO-CTL, PD1-KO-CTL + iRGD, and PD1-KO-CTL-iRGD. Weight of tumors collected 2 weeks post treatment (g). Survival curves were analyzed with log-rank test. Tumor volume and tumor weight were analyzed with Student’s t test. Data are represented as mean ± s.e.m., n = 7; n.s, not significant; *p < 0.05; **p < 0.01; ***p < 0.001

