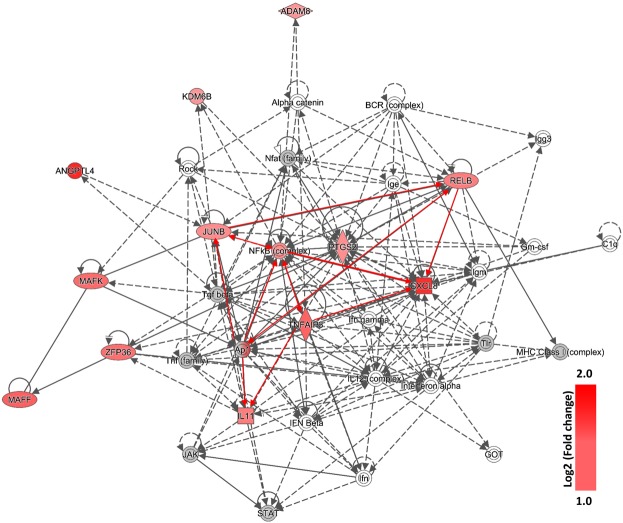
Figure 5.
Sub-network of the innate signaling pathway obtained after IPA analysis of the differentially expressed genes in A549 lung epithelial cells infected with WM 06.482 conidia. Significantly up-regulated genes are shown in red, the intensity of red color shows the level of up-regulation of the gene expressed as log2 (fold change). The genes that did not show any changes in expression after 8 h of incubation with WM 06.482 are shown in grey. The full network is presented as Supplementary Fig. S1.

