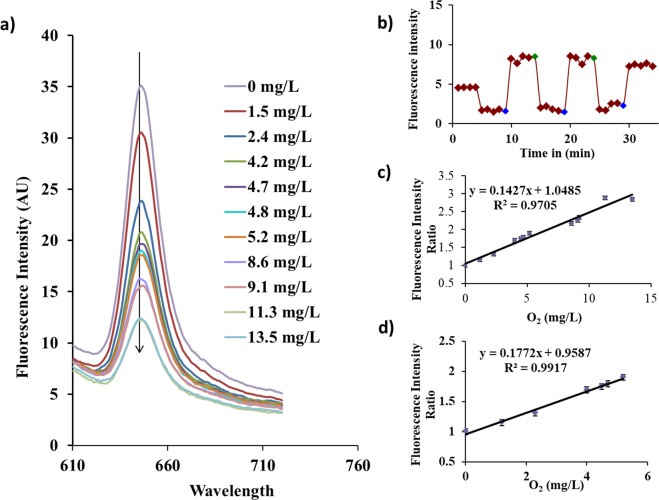
Figure 3.
(a) Fluorescence emission overlay representing changes due to differences in oxygen concentration 0–14 mg/L of Pt-Porphyrin-PLA nanoparticles loaded hybrid alginate formulation with changing oxygen concentration. (b) Typical dynamic response curve for Pt-Porphyrin loaded PLA nanoparticles when bubbled with Nitrogen and Oxygen. (c,d) Calibration curves for hybrid microparticles in different ranges: 0–13 mM and 0–6 mM. Readings in the calibration curve were determined as mean values of n = 3 experiments and y error bars signify the standard deviation.

