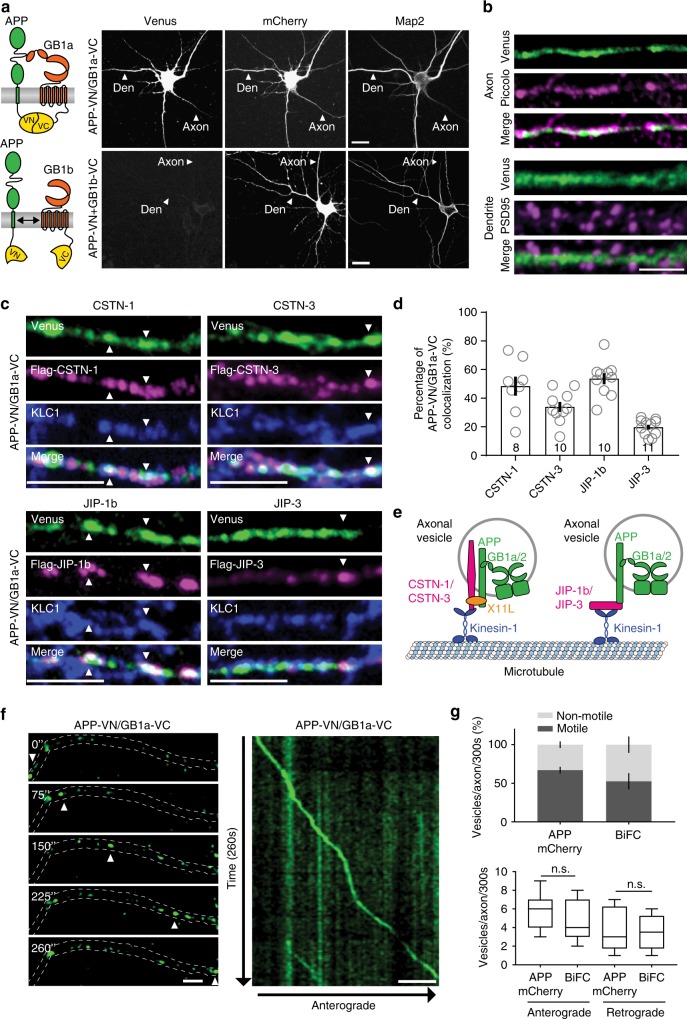
Fig. 5.
The APP/GB1a complex co-localizes with CSTN and JIP proteins in axons. a Scheme depicting the BiFC principle27. Complex formation of APP-VN with GB1a-VC reconstitutes Venus fluorescence and leads to BiFC. GB1b-VC serves as a negative control. Representative confocal images show hippocampal neurons (DIV10) expressing APP-VN together with GB1a-VC or GB1b-VC. BiFC is observed in axons and dendrites for GB1a-VC. Microtubule-associated protein Map2 identifies dendrites; mCherry served as a volume marker. Neurons were imaged 7 h post-transfection27. Scale bar 10 μm. b Higher magnification of axons and dendrites of hippocampal neurons transfected with APP-VN and GB1a-VC. The BiFC complex (Venus) partly co-localizes with piccolo (magenta) in axons. The BiFC complex is also present along dendritic shafts but excluded from spines (PSD-95, magenta). Scale bar 5 μm. c Partial co-localization (white, arrowheads) of the BiFC complex (green) with FLAG-CSTN-1, FLAG-CSTN-3, FLAG-JIP-1b, and FLAG-JIP-3 (magenta) and endogenous kinesin light-chain 1 (KLC1) (blue) in the axons of neurons. Scale bar 5 μm. d Quantification of the co-localization of the BiFC complex with FLAG-CSTN-1, FLAG-CSTN-3, FLAG-JIP-1b, and FLAG-JIP-3. The n numbers of neurons analyzed are indicated. e Scheme illustrating that APP together with interacting JIP and CSTN proteins link the GB1a/APP complex in cargo vesicles to axonal kinesin-1 motors. The neural adaptor protein X11-like (X11L) connects APP to CSTN-122. f Time-lapse images of a well-separated APP-VN/GB1a-VC complex trafficking anterogradely in axons (acquisition times in seconds). White arrowheads mark a fluorescent APP-VN/GB1a-VC complex. A kymograph shows the entire time-lapse recording (right). Scale bars 25 μm. Data are presented as mean ± s.e.m. g Top: Analysis showing the percentage of mobile and non-mobile vesicles per axon within 5 min in hippocampal neurons expressing APPmCherry or the BiFC complex. Bottom: Number of vesicles moving antero-gradely and retrogradely per axons within 5 min. Data are presented in a min to max-box and whisker plot, with whiskers representing the smallest and largest values, the boxes representing the 25–75% percentile and the middle line representing the median. P > 0.05, one-way ANOVA. Source data are provided as a Source Data file

