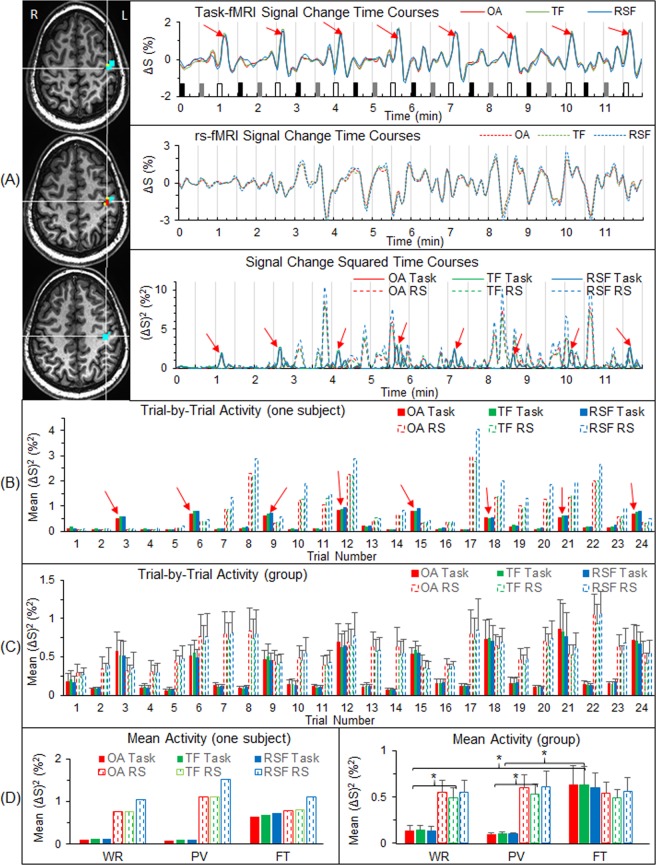
Figure 1.
Comparison between the task activity and the intrinsic activity at the level of voxels. (A) For a representative participant, the three images show a task-fMRI FAUPA (TF) and a rs-fMRI FAUPA (RSF) with an overlapped area (OA) between them in the left primary sensorimotor cortex. The TF comprises the three yellow voxels plus the two red voxels of the OA, and the RSF comprises the fourteen cyan voxels plus the two red voxels. The three solid lines in the top panel show the time courses of the BOLD signal change of the task-fMRI for the three areas (green for TF, blue RSF and red OA) in the top plot. The task paradigm consisted of 24 trials shown by the 24 bars: black bars representing word-reading, gray bars pattern-viewing and white finger-tapping. Each task lasted 6 s followed by 24 s rest. The three dashed lines in the middle panel show the time courses of the BOLD signal change of the rs-fMRI for the three areas, and reflect the intrinsic activity in these areas during the 12-min resting-state. The bottom panel shows the time courses of the square of the BOLD signal change for both task-fMRI (solid lines) and rs-fMRI (dashed lines). Eight red arrows point out the large signal changes associated with the underlying neural activity evoked by the finger tapping task14. The three dashed lines represent their corresponding time courses of the intrinsic activity measured with the rs-fMRI. (B) For the same participant, the solid bars represent the task activity averaged over each trial period for the 24 trials, and the dashed bars represent the corresponding intrinsic activity for the corresponding periods. (C) As B averaged for the nine participants. (D) As B averaged over the eight trials of each task type for the representative participant (left) and the corresponding average for the group (right). For each of the three areas (TF, RSF and OA), the intrinsic activity was significantly larger than the task activity for both WR and PV (*: paired t-test, the maximal p < 0.01). The bar indicates the corresponding standard error of the mean across the participants.

