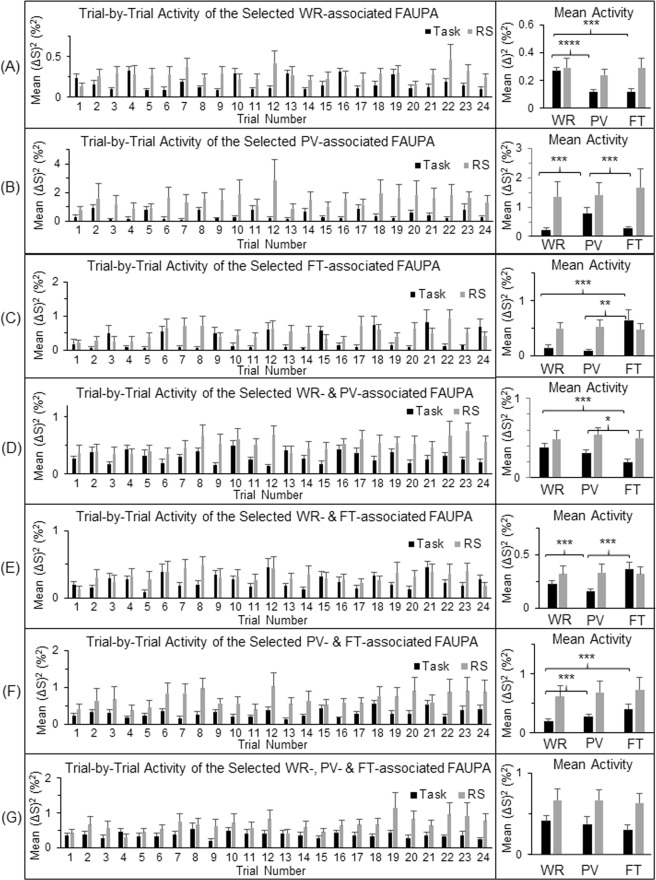
Figure 3.
Comparison of the neural activity (BOLD signal change squared14) during the task-fMRI and the rs-fMRI at the level of the seven selected task-associated FAUPAs. For each of the seven functional groupings of the task-associated FAUPAs, the left plot shows the group-mean activity of the selected FAUPA from trial to trial for that category. For each participant and each category, the trial-mean activity averaged over the eight trials was computed first for the three tasks, and then the group-mean of this trial-mean activity was compared for the three tasks (the right plot). The intrinsic activity shown by the gray bars is consistently higher than the task-evoked activity throughout. The error bar indicates the corresponding standard error of the mean across the participants. *p < 0.05; **p < 0.01; ***p < 0.005; and ****p < 0.0001 (paired t-test).

