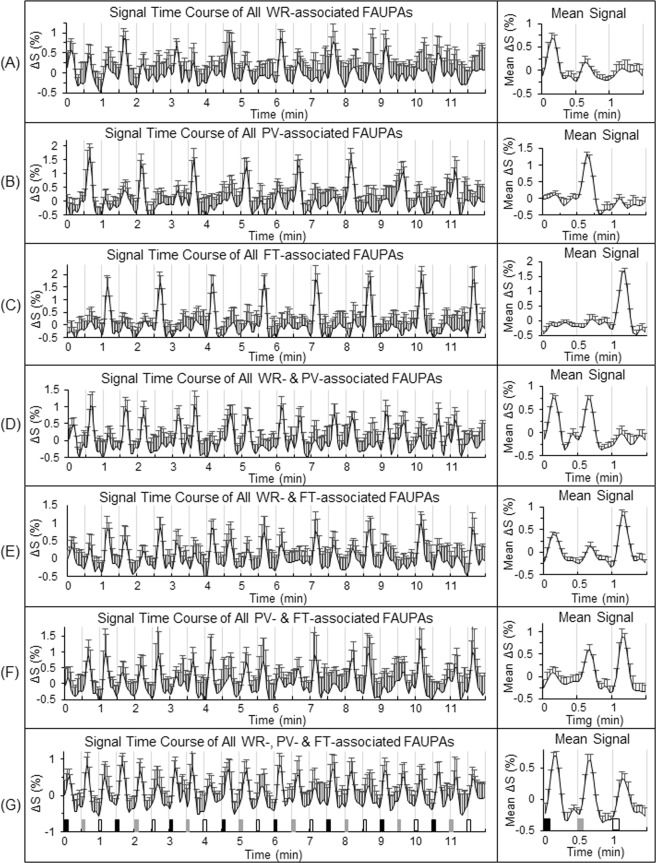
Figure 4.
Illustration of the three task-specific networks. For each of the seven functional groupings illustrated in Fig. 2, for each participant the signal time course of the selected FAUPA was used to identify all task-associated FAUPAs for the category. The left plot in each panel represents the time course of the group-mean signal change of all identified task-associated FAUPAs for that category. For each participant, the trial-mean signal change was computed first for the three tasks, and then the group-mean of this trial-mean signal change was compared for the three tasks (the right plot). They are remarkably similar as those of the seven selected task-associated FAUPAs shown in Fig. 2. These task-associated FAUPAs were distributed across the whole brain, and could be further functionally grouped to compose task-specific networks. A task-specific network is defined as a set of FAUPAs in which each FAUPA is activated when the task is performed, and accordingly, there were three task-specific networks identified for the task-fMRI. The WR-specific network, for example, consisted of task-associated FAUPAs in the four functional groupings of (A,D,E,G), the PV-specific network was composed of FAUPAs in (B,D,F,G) and the FT-specific network comprised FAUPAs in (C,E,F,G), respectively. The WR-specific network was activated when each of the eight WR tasks was performed, but the other two networks remained relatively “quiet”, implying the separation of the three networks. The same was true of the other two task-specific networks. The error bar indicates the corresponding standard deviation across the participants.

