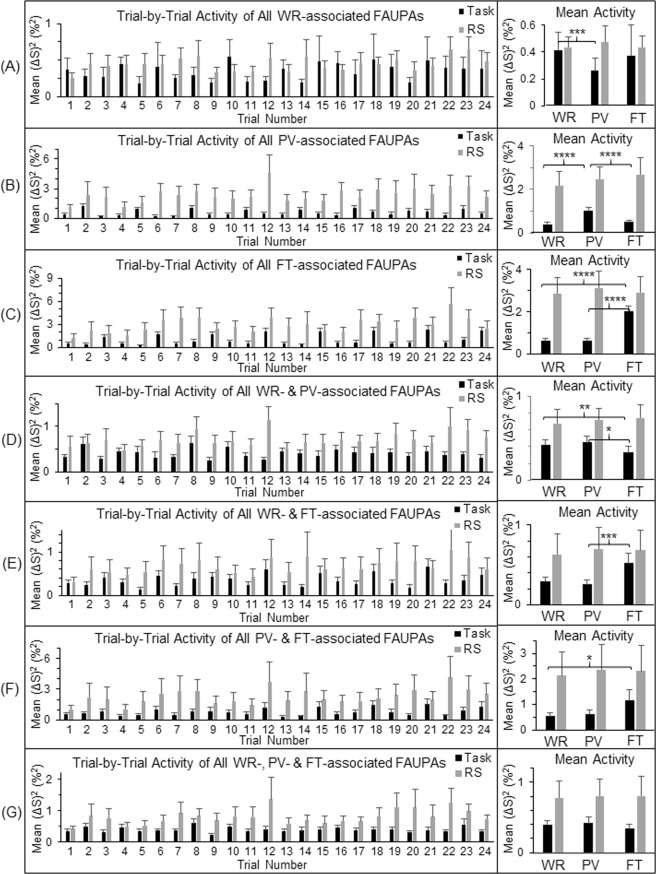
Figure 5.
Comparison of the neural activity during the task-fMRI and the rs-fMRI at the level of the three task-specific networks. For each of the seven functional groupings of the task-associated FAUPAs, the left plot shows the group-mean activity of all identified task-associated FAUPAs from trial to trial for that category. For each participant and each functional grouping, the trial-mean activity was computed first for the three tasks, and then the group-mean of this trial-mean activity was compared for the three tasks (the right plot). For each of the three task-specific networks defined in the legend of Fig. 4, the activity from trial to trial is characterized by the corresponding activity of the four categories that compose the network. For example, the activity of the FT-specific network from trial to trial is characterized by the activity of the categories (C,E,F,G). This network was activated each time the FT task was performed but remained relatively “quiet” for both the WR and PV tasks. The intrinsic activity shown by the gray bars is consistently higher than the task-evoked activity throughout. The error bar indicates the corresponding standard error of the mean across the participants. *p < 0.05; **p < 0.01; ***p < 0.005; and ****p < 0.0001 (paired t-test).

