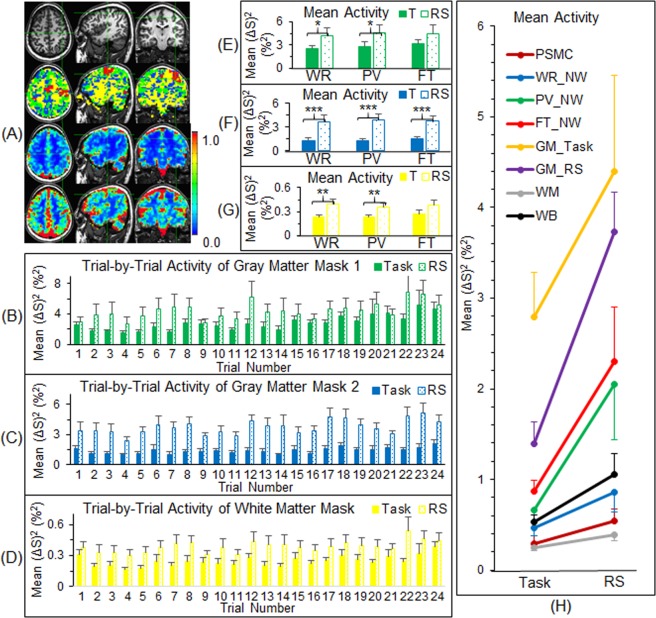
Figure 6.
Comparison of the neural activity between the task-fMRI and the rs-fMRI at the level of gray matter, white matter and whole brain. (A) The three images in the second row illustrate four masks represented by four colours (only three slices in the representative participant are selected for illustration): (1) the red clusters represent the network mask that consisted of the three task-specific networks; (2) the green clusters represent the first mask of the gray matter that consisted of all FAUPAs identified with the task-fMRI, excluding the network mask; (3) the blue clusters represent the second mask of the gray matter that consisted of all FAUPAs identified with the rs-fMRI, excluding all FAUPAs identified with the task-fMRI; and (4) the yellow clusters represent the white matter mask that consisted of the whole brain mask, excluding all FAUPAs identified with both task- and rs-fMRI. The images in the third row and in the last row show the overall temporal mean of the task activity and of the intrinsic activity, respectively. The colour bar represents the magnitude of activity (%2). (B–D) The trial-by-trial activity for the first gray matter mask, the second gray matter mask and the white matter mask, respectively. Note that the intrinsic activity is consistently larger than the task activity throughout. (E–G) The activity averaged over the eight trials for the first gray matter mask, the second gray matter mask and the white matter mask for the three tasks, respectively. (T: task; *p < 0.05; **p < 0.02; ***p < 0.0005; paired t-test.) (H) Comparison of the overall mean activity (averaged for all time points) between the task activity and the intrinsic activity from the level of voxels to the whole brain. The intrinsic activity is about twice that of the task activity at each level, and the mean and standard deviation of their relative differences were 116 ± 57 (%). PSMC: primary sensorimotor cortex; NW: network; GM: gray matter; WM: white matter; and WB: whole brain. The error bar indicates the corresponding standard error of the mean across the participants.

