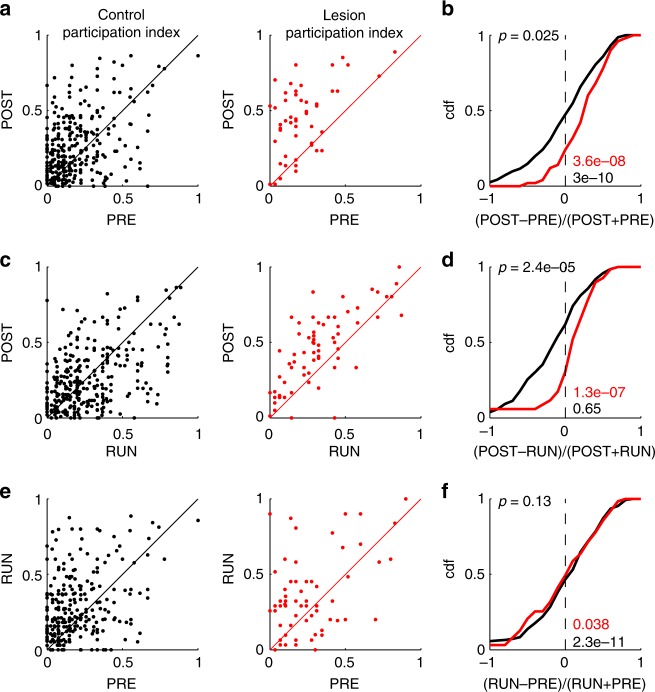
Fig. 4.
Place cell participation in spatial sequences. a, c, e Correlation of cell-wise participation in significant spatial sequences between two epochs. Each dot indicates the participation of a place cell in significant spatial sequences in the two epochs indicated on the axes (POST vs. PRE: a, b POST vs. RUN: c, d; RUN vs. PRE: e, f). Left: control animals (black); right MEC-lesioned animals (red). b, d, f CDFs of the relative changes (as indicated at the x-axis) from the data in (a, c, e). The p values at the bottom right were derived from signed-rank tests of medians larger than 0 (PRE–POST Control: s.r. = 33274, n = 312 place cells; PRE–POST MEC-lesioned: s.r. = 1281, n = 52 place cells; RUN–POST Control: s.r. = 23794, n = 314 place cells; RUN–POST MEC-lesioned: s.r. = 2290, n = 73 place cells; PRE–RUN Control: s.r. = 34498, n = 310 place cells; PRE–RUN MEC-lesioned: s.r. = 1344.5, n = 65 place cells). The p value on the top left was obtained by a ranksum test on identical group medians (PRE–POST: r.s. = 55,364, ncontrol = 312 place cells, nlesion = 52 place cells, RUN–POST: r.s. = 57,277, ncontrol = 314 place cells, nlesion = 73 place cells; PRE–RUN: r.s. = 59,490, ncontrol = 310 place cells, nlesion = 65 place cells)

