Fig. 5.
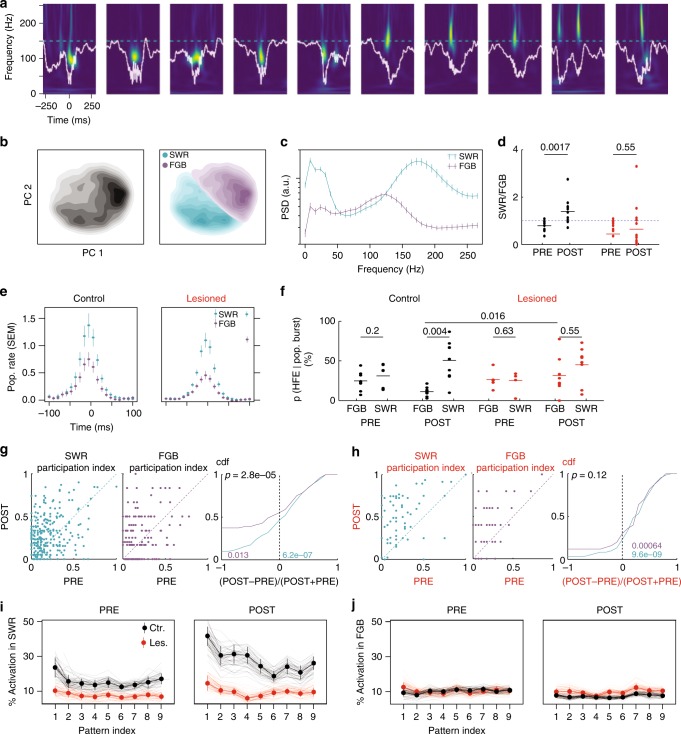
Local field potential correlates of pattern activation and place cell bursts. a Ten example traces (white) and corresponding power spectrograms of HFEs (color scale normalized; warm colors indicate high power). Dashed cyan line indicates 150 Hz. b Left: Density plot of principal component (PC) projections of the spectrogram from one example session (PRE and POST) of a control animal. Right: Same plot with cluster labels. c Power spectral densities from (b). Error bars: 99th-percentile. d Fraction of SWRs vs. FGBs in the PRE and POST epochs (black: Control; red: MEC-lesion, blue dashed line indicates unity; see main text for statistics). e Population rates (cell-wise z-scored) triggered by the peak of the HFE. Error bars are 68th-percentiles. f Percentages of place cell bursts that coincide with an HFE (±150 ms, colors as (d)). p Values above bars from signed-rank tests (Control PRE: s.r. = 8, n = 8; Control POST: s.r. = 0, n = 9; MEC-lesioned PRE: s.r. = 5, n = 5; MEC-lesioned POST: s.r. = 13, n = 8) and a ranksum test when comparing between animal groups (see main text). g Cell-wise participation in significant spatial sequences. Only significant replays are considered in a ±150 ms window triggered by an HFE. Right: CDF of relative changes. p Value (black) from ranksum test for group medians (r.s. = 83,934, nSWR = 306 place cells, nFGB = 198 place cells). Colored p values from signed-rank tests for median being negative (purple, FGB; s.r. = 7180, n = 198 place cells) or positive (cyan, SWR; s.r. = 29305, n = 306 place cells). h Same as (g) for MEC-lesioned animals (ranksum test comparing FGB and SWR: r.s. = 4573, nSWR = 70, nFGB = 51; purple p value from signed-rank tests for positive median, s.r. = 1007, n = 51; cyan: s.r. = 1985, n = 70). i Percentage of pattern activation events coinciding with an SWR (±50 ms). Labels on the x-axis indicate the pattern (principal component) from the co-activation analysis (see main text for statistics). Error bars indicate 66th-percentiles. j Same as (i) for FGBs

