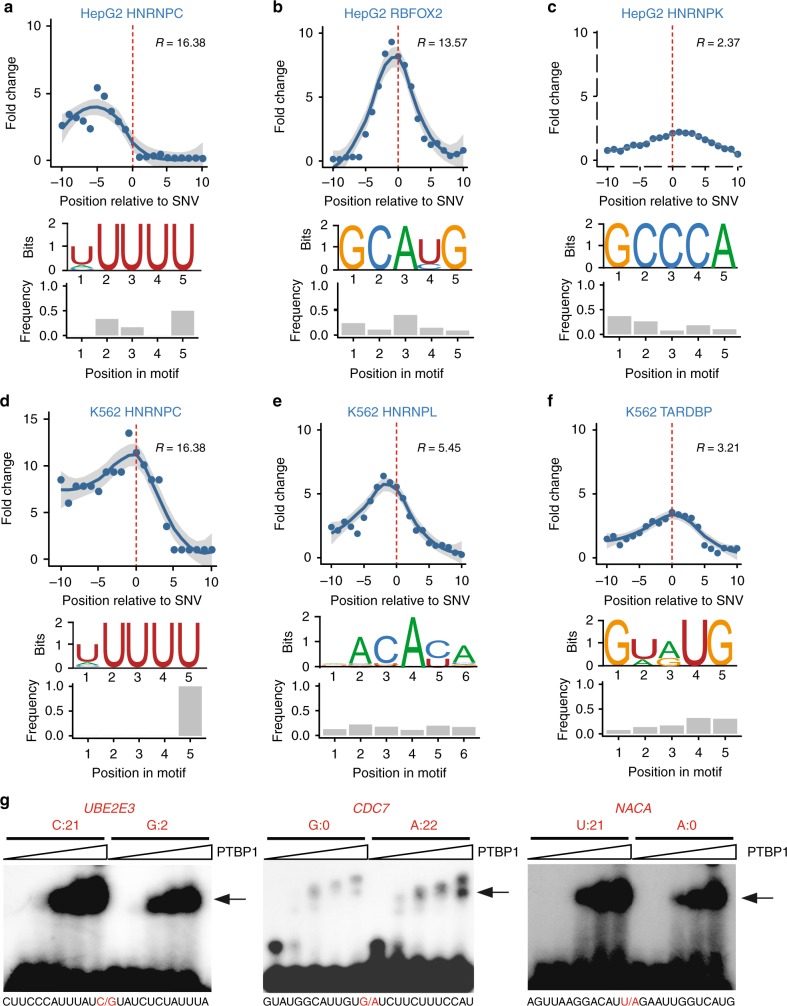
Fig. 3.
Bioinformatic and experimental validation of allele-specific binding (ASB). a–f Enrichment of RNA Bind-n-Seq (RBNS) motifs in the regions around ASB single-nucleotide variants (SNVs) (x = 0) of each RNA-binding protein (RBP) (upper panel). Y-axis shows fold change in the enrichment relative to randomly chosen control regions (Methods). Ten sets of controls were constructed, with the regression curve and 95% confidence interval of the average fold change shown in the panel. RBNS motifs used in the analysis are shown (middle panel). The relative frequency of the ASB SNVs overlapping each motif position is shown in the bar graph (lower panel). g Electrophoretic mobility shift assays (EMSA) results of PTBP1 binding to its ASB targets. Alternative alleles of the ASB SNVs were synthesized, as labeled above the gel images. Read count (sum of two replicates) for each allele in the enhanced crosslinking and immunoprecipitation (eCLIP) data of PTBP1 (HepG2 cells) is shown. (Images are cropped, with uncropped images in Supplementary Figure 16.) The sequences of the synthetic RNA fragments are shown below each gel image, where the ASB SNV is highlighted in red. The arrow indicates RNA–protein complex. Increasing concentrations of PTBP1 were used in different lanes of the gel image (from left to right: 0, 0.6, 1.2, 2.5, and 5 μg). (Source data are provided as a Source Data file)

