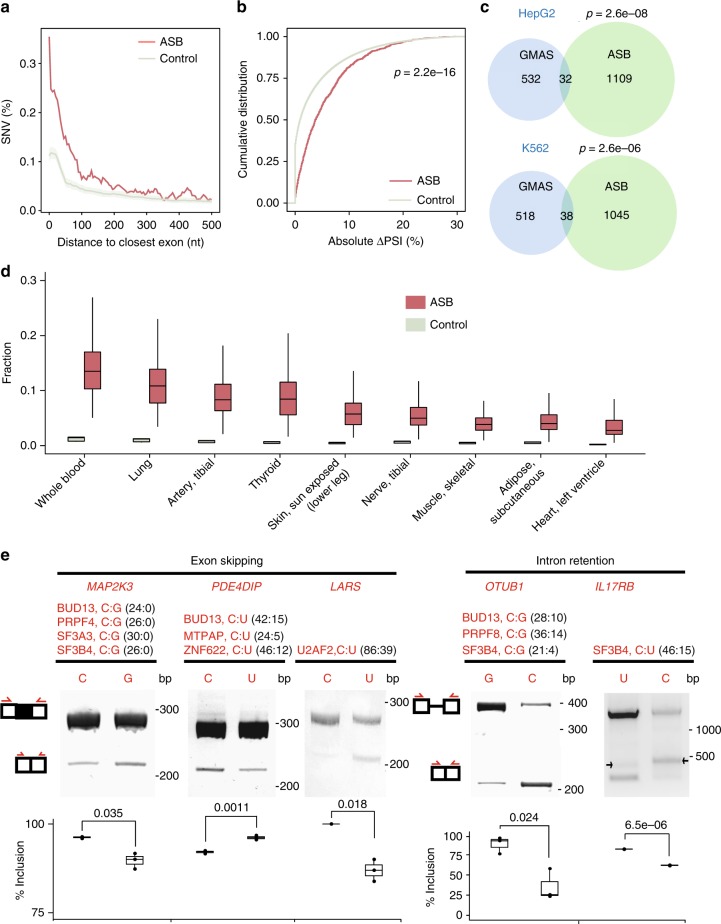
Fig. 4.
Functional relevance of allele-specific binding (ASB) single-nucleotide variants (SNVs) in splicing regulation. a Distance of intronic ASB SNVs to the nearest splice sites. Controls consist of randomly chosen SNVs in the same introns. A total of 100 sets of controls were constructed, with the average and standard deviation shown in the plot. b Absolute change in the percent spliced-in (PSI) values of exons associated with ASB events of splicing factors upon knockdown of the respective splicing factor in HepG2 or K562 cells. Controls were random intronic SNVs in the same introns. P value was calculated by the Kolmogorov–Smirnov test. c Overlap between ASB SNVs of splicing factors and heterozygous SNVs associated with genetically modulated alternative splicing (GMAS) events in the genes harboring ASB SNVs. P values were calculated by the hypergeometric test (see Methods). d Fraction of ASB SNVs located in GTEx splicing quantitative trait loci (sQTL) exons or within 500 nucleotide (nt) in their flanking introns among the union of ASB SNVs of all splicing factors in the HepG2 or K562 data. This fraction was calculated for each sample individually, with the distribution of all samples in a tissue shown in the box plots. Control: fraction of randomly chosen heterozygous SNVs within genes in the above regions in each sample. e Splicing reporter validation of the function of ASB events. Three exon skipping events and two intron retention events are included. The gene names with the ASB events, the associated RNA-binding proteins (RBPs), RNA alleles of the ASB SNV, and their read counts in enhanced crosslinking and immunoprecipitation (eCLIP) are shown. (Images are cropped, with uncropped images in Supplementary Figure 16.) The red arrows in the exon–intron diagrams indicate positions of PCR primers. Inclusion level (three biological replicates) of the exon or intron is shown below each gel image. P values were calculated by Student’s t-test. Note that the IL17RB minigene had alternative splice sites in the intron, which led to the extra bands (black arrows). Boxplot center lines indicate the median and the boxes extend to lower and upper quartiles with whiskers depicting 1.5 interquartile range (IQR). (Source data are provided as a Source Data file)

