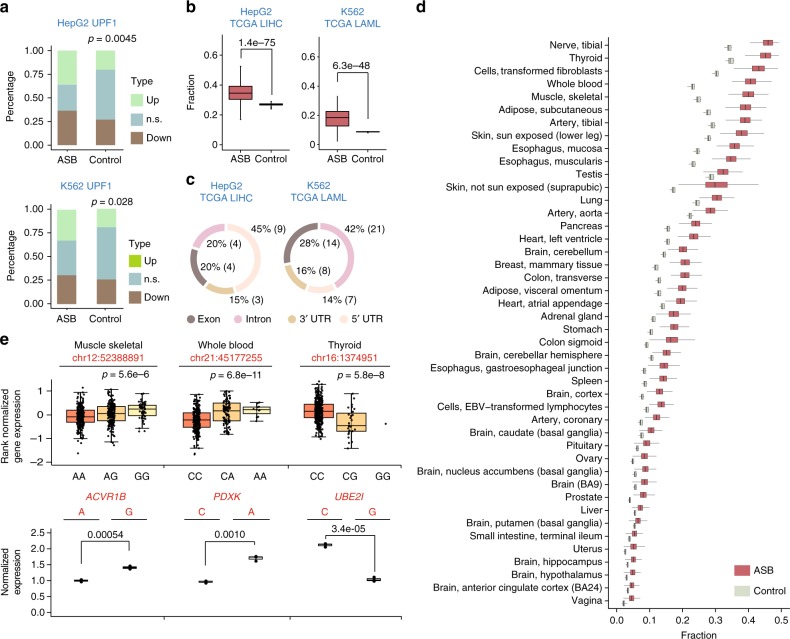
Fig. 5.
Functional relevance of allele-specific binding (ASB) single-nucleotide variants (SNVs) in regulating messenger RNA (mRNA) abundance. a Fraction of differentially expressed genes (up- or down-regulated, false discovery rate (FDR) <10%) upon UPF1 knockdown in HepG2 or K562 cells. n.s.: not significant. Data for genes with ASB SNVs of UPF1 in their 3′-untranslated regions (3′-UTRs) and control genes are shown, where the controls were chosen as genes without UPF1 enhanced crosslinking and immunoprecipitation (eCLIP) peaks and with similar expression levels as UPF1 targets (within +/−30% of RPKM). P values were calculated to test the null hypothesis that UPF1 ASB target genes are not enriched with up-regulated expression upon UPF1 knockdown (KD), compared to controls (binomial test). b Fraction of ASB SNVs located in expression quantitative trait loci (eQTL) genes among the union of ASB SNVs of all RNA-binding proteins (RBPs) of each cell line. eQTL genes were extracted from the The Cancer Genome Atlas (TCGA) project for liver hepatocellular carcinoma (LIHC) and acute myeloid leukemia (LAML), respectively, to match the cell type of HepG2 and K562. This fraction was calculated for each sample individually, with the distribution of all samples shown in the box plots. Control: fraction of control SNVs located in eQTL genes where control SNVs were randomly chosen from heterozygous SNVs located within genes. P values were calculated by pair-wise t-test. c Genomic context of ASB SNVs that are heterozygous in TCGA samples and located in the eQTL genes. Exon: coding exons; no non-coding transcripts existed among eQTL genes included in this analysis. d Similar as (b), for eQTL genes in GTEx tissues. e Expression of minigenes carrying alternative alleles of ASB SNVs in the 3′-UTR of mCherry. mCherry expression measured via real-time quantitative reverse transcription PCR (qRT-PCR) was normalized by that of eYFP (driven by bi-directional promoters). Three biological replicates were analyzed. P values were calculated by Student’s t-test. Box plots (top) show the normalized gene expression values of the host genes in selected GTEx tissues, grouped by genotypes of the ASB SNV (coordinates shown above box plots). The expression values and eQTL p values were obtained from the GTEx portal33. Boxplot center lines indicate the median and the boxes extend to lower and upper quartiles with whiskers depicting 1.5 interquartile range (IQR). (Source data are provided as a Source Data file)

