Fig. 4.
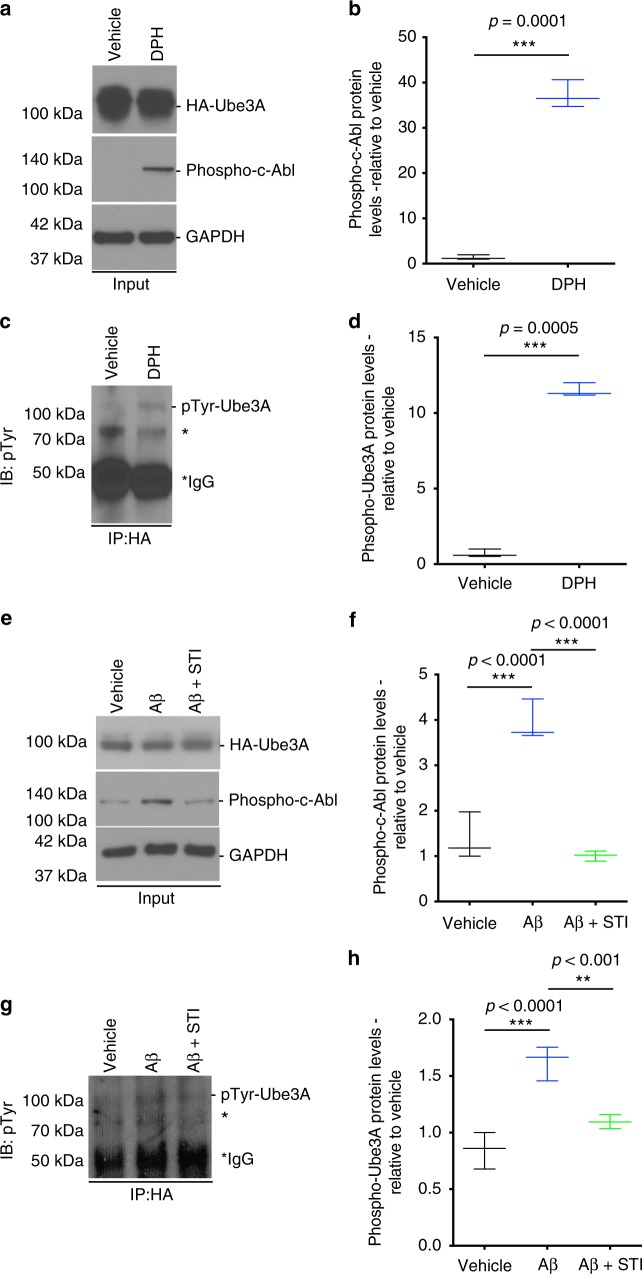
oAβ induces c-Abl phosphorylation and Ube3A destabilization in rat primary hippocampal neurons. a–c Representative western blot showing levels of HA-Ube3A and phospho-c-Abl in the input fraction, and the levels of phospho-Ube3A (IB:pTyr) in the immunoprecipitated (IP:HA) fraction of transfected B35 cells treated with either vehicle or DPH. b–d Quantification of western blot data showing elevated levels of phospho-c-Abl (b) and phospho-Ube3A (d) in DPH-treated (1 h) relative to vehicle-treated cultures. e–g Representative western blot showing levels of HA-Ube3A and phospho-c-Abl in the input fraction, and the levels of phospho-Ube3A (IB:pTyr) in the immunoprecipitated (IP:HA) fraction of transfected B35 cells treated with either vehicle or oAβ (2 h) in the presence or absence of c-Abl inhibitor STI (1 h pre-treatment). f–h Quantification of western blot data showing elevated levels of phospho-c-Abl (b) and phospho-Ube3A (d) in oAβ-treated (6 h) relative to vehicle-treated cultures, and abrogation of this increase by STI (1 h pre-treatment). Protein quantifications were normalized to glyceraldehyde 3-phosphate dehydrogenase (GAPDH) as housekeeping gene. Data presented as mean ± min. to max. values of N = 3 independent cultures. Note that statistical analyses were performed using unpaired Student’s t-test (b, c) and one-way analysis of variance (ANOVA) followed by Tukey's post hoc multiple comparisons (f–h). *Unidentified band

