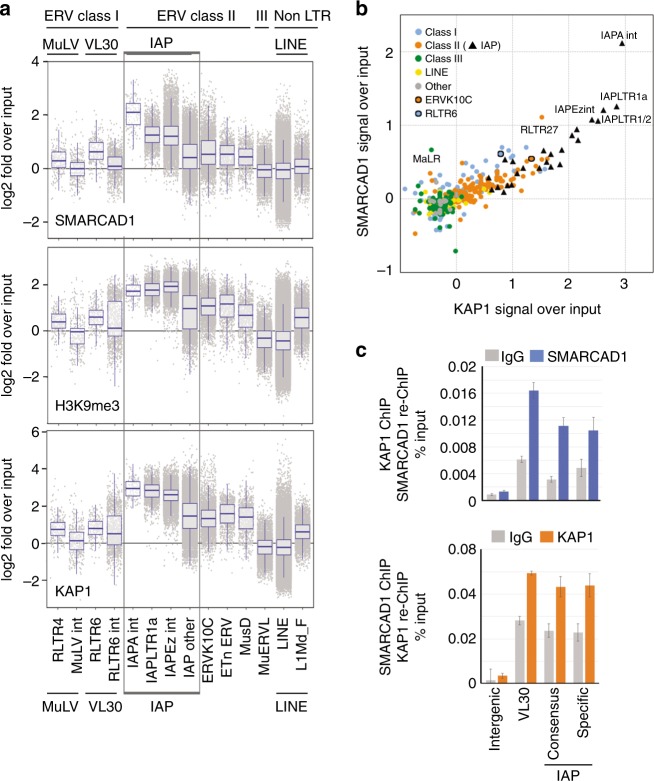
Fig. 2.
SMARCAD1 co-occupies classes I and II ERVs with H3K9me3 and KAP1. a Comparison of SMARCAD1 (top, this study), H3K9me3 (middle, this study) and KAP1 (bottom34) enrichment at various repeat classes in mESCs. Combined box- and jitterplot depicting log2 fold ratio over input of normalized read counts (TPM) in the indicated ChIP-seq experiments (log2 (TPM ChIP/TPM Input)). In the boxplot center lines show the median; lower and upper box lines correspond to 25th and 75th percentiles, while whiskers extend from the hinge to the smallest (largest) datum not further than 1.5 times the interquartile range. Each dot represents a single repetitive element. Repeat subfamilies were categorized according to their UCSC RepeatMasker annotation. “int” indicates that the repeat is an internal ERV sequence. LTR long terminal repeat. IAP elements are boxed: IAPA_MM-int, IAPEz-int and IAPLTR1a are the most enriched elements, followed by “IAP other” which represents all other IAP elements. LINE: all repetitive elements of the repeat family LINE, except L1Md_F. L1Md_F was analysed separately as it was reported to exhibit high KAP1 enrichment20. See also Supplementary Figure 3a. b Comparison of SMARCAD1 and KAP1 binding on retrotransposons reveals strong enrichment of both proteins at IAP subfamilies (black triangles). A correlation of binding over several classes I and II ERV family members is apparent. Data points represent median signals over input of SMARCAD1 ChIP-seq data from PGK12.1 ESCs and KAP1 data from ref. 34. c SMARCAD1 and KAP1 co-occupancy at ERV elements of class I (VL30) and class II (IAPs) in mESCs was assessed by sequential re-ChIP using SMARCAD1 and KAP1 antibodies followed by qPCR. Consensus IAP primers recognize the 5’UTR, specific IAP primers an IAP region (Mier3) at chromosome 13. An intergenic control site is neither bound by SMARCAD1 nor by KAP1. The percentage of input values are mean ± S.E. of technical triplicates

