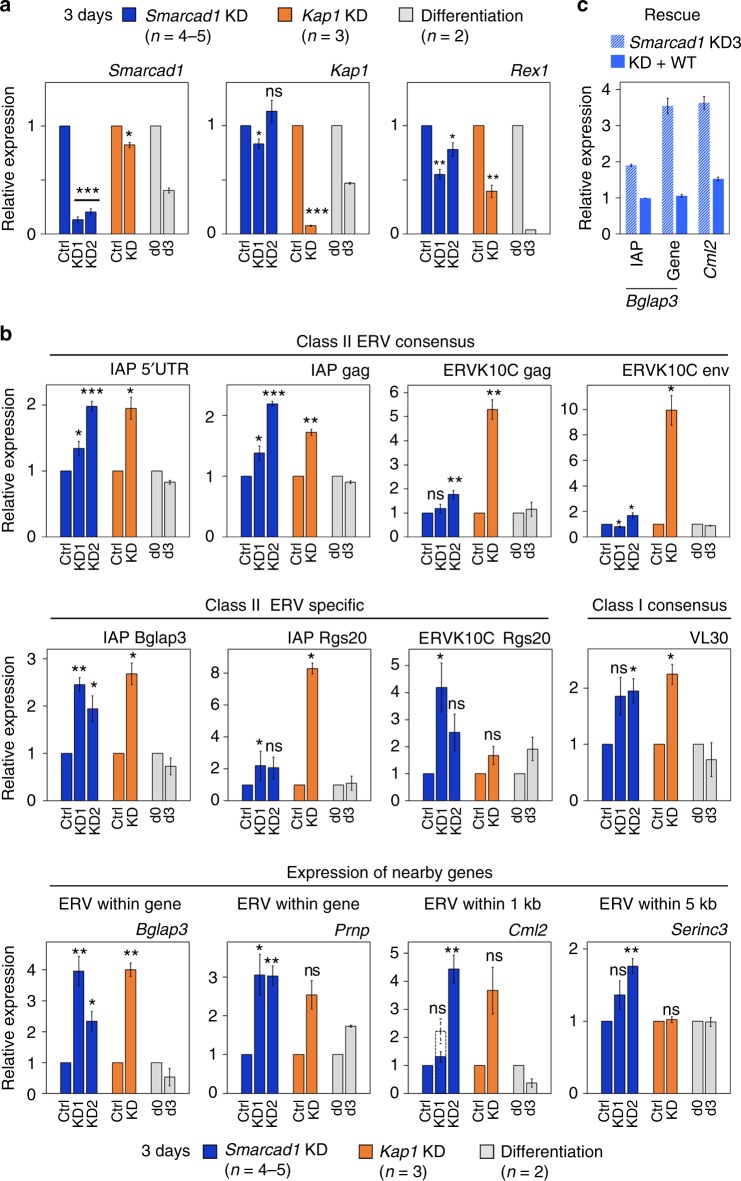
Fig. 4.
Re-activation of ERVs and neighboring genes upon SMARCAD1 knockdown. a, b RT-qPCR data of SMARCAD1 (n = 4–5) or KAP1 (n = 3) depleted ESCs (E14), at day 3 after shRNA transfection. Controls include ESC differentiation samples (n = 2) derived from cells grown in the absence of LIF for 0 days (d0; undifferentiated) or 3 days (d3, differentiation). Data are the mean ± S.E. normalized to 2–3 housekeeping genes. Similar results were obtained in another ESC line and under 2i conditions (Supplementary Figure 7a, b). a Efficiency of each KD was determined with primers specific for Smarcad1 and Kap1. Differentiation was monitored using the pluripotency marker Rex1. Protein analysis is shown in Supplementary Figure 6c. b Expression analysis of indicated retrotransposons using consensus and specific primers. Bottom row; Expression of Bglap3, Prnp, Cml2 and Serinc3 genes, which either harbor SMARCAD1 bound ERVs or are located in the proximity thereof. Smarcad1 KD1 showed no clear upregulation of Cml2 at day 3 after transfection, therefore additional analysis on Cml2 was carried out at day 4 (dotted column; n = 2). IGV screenshots depicting analysed loci are in Supplementary Figure 8a. c Exogenous SMARCAD1 represses Bglap3 IAP and Bglap3 and Cml2 genes (left to right) in Smarcad1 knockdown cells. RT-qPCR was performed on E14 cells treated with an shRNA against the 3′-UTR of Smarcad1 for 4 days in the absence (KD3) or presence (+WT) of exogenous SMARCAD1. Error bars present mean ± S.E. of biological duplicates relative to three reference genes. Expression levels of SMARCAD1 were examined by immunoblotting in Supplementary Figure 4f. P-values are from paired two-tailed Student’s t-test: *p < 0.05, **p < 0.01, ***p < 0.001; ns not significant

