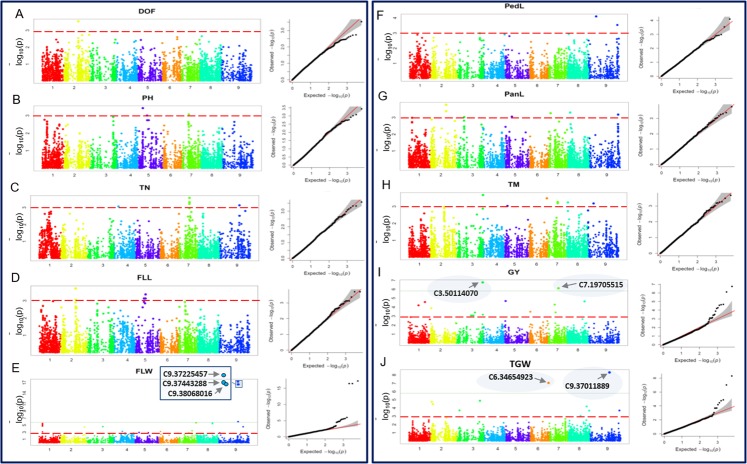
Figure 3.
Manhattan plots and quantile-quantile (Q-Q) plots (A and J) of the GWAS results for following 10 traits including Days to flowering (DOF), plant height (PH), tiller number (TN), flag leaf length (FLL), flag leaf width (FLW), peduncle length (PedL), panicle length (PanL), tiller maturity (TM), grain yield (GY), and 1000 grain weight (TGW), respectively. Significant MTA threshold [−log 10 (p) < 10−03] and Bonferroni threshold are represented by dash (red) and continuous (grey) lines, respectively. x-axis represents chromosomes.

